How EO expertise powers agri-monitoring decisions (Part 2)
This blog post is the second part of a multi-post series.
# Introduction
The first part of this blog post series introduced the Area Monitoring System (AMS) and the EO-WIDGET project. Furthermore, it covered the user interface components developed in the EO-WIDGET context.
This second part will go into detail about the API (Application Programming Interface) services powering the user interface (UI). While vector tiles are at the center of data exchange between frontend and backend services of the AgriApp, several RESTful APIs, WMS endpoints and other interfaces are provided, which a paying ageny can plug into their own system.
# Open Value Chain
The EO-WIDGET project envisions an open value chain. This means that the system architecture can interface with any set of data and/or algorithm providers. The system is also agnostic to the API consumer: While the AgriApp consumes the API via a customizable user interface (presented in part 1 of this blog post series), the modular API components can also be readily integrated into a paying agency's in-house tools.
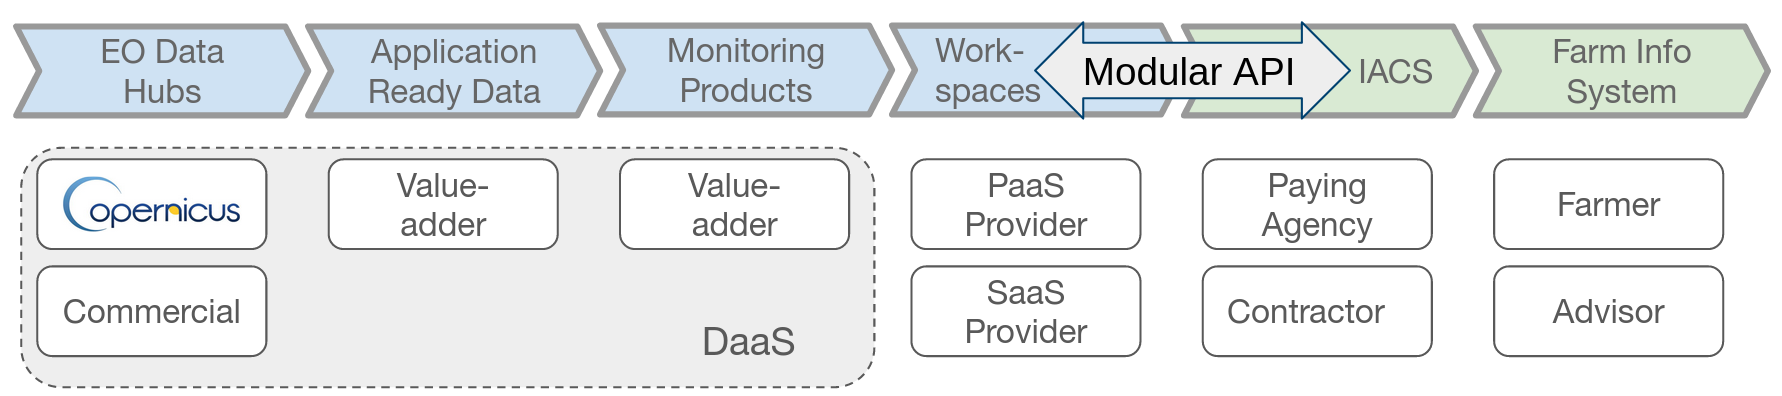
In more technical terms, all satellite products of Level 2 (atmospherically corrected imagery) through Level 4 (derived variables, i.e. markers) are offered, complimented by compliance results following the Checks by Monitoring (CbM) / Area Monitoring System (AMS) decision processes.
# Satellite Imagery Catalog & WMS
The AgriApp is backed by powerful satellite imagery cataloging and viewing technology. This enables the operator to visualize the phenological development of a parcel over time using multiple sensors & processed products (i.e. Sentinel-1, Sentinel-2, Planet Fusion, different vegetation indexes, etc.). Visualizations are also available for direct integration into internal paying agency tools.
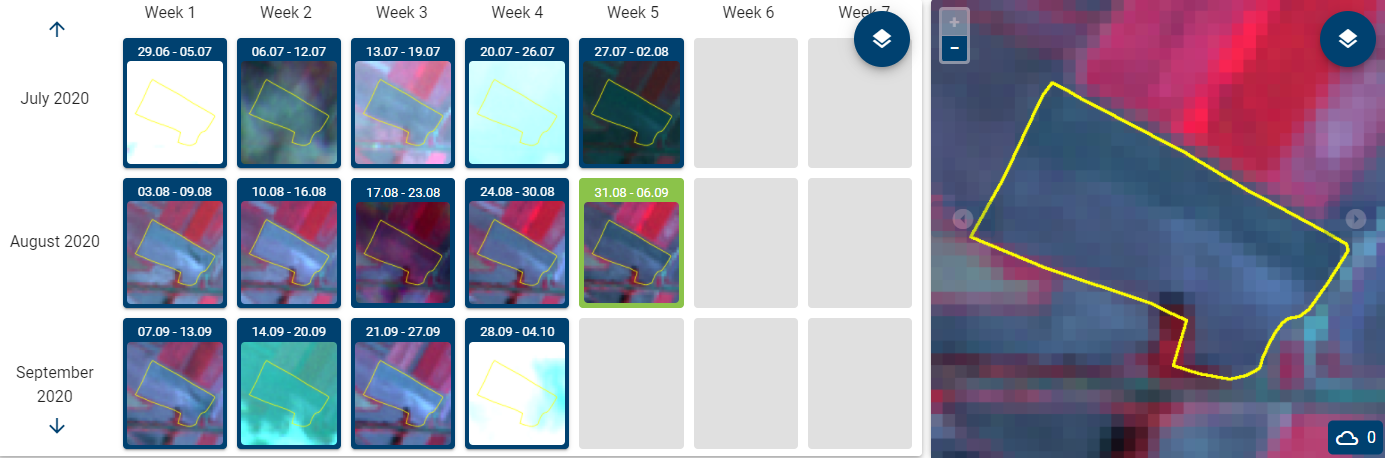
Within the AgriApp, a calender widget allows interactive selection of single image chips and an image grid provides an overview of crop development across multiple months. The latter takes advantage of cloud cover information and surfaces the best image for a week accordingly. The structure and the content of the image chips are optimised to support validation of different thematic products.
Additionally, satellite images can be viewed as true and false color composites for easier insights by Computer Aided Photo Interpretation (CAPI) experts. Different vegetation indexes – such as NDVI – can also be presented.
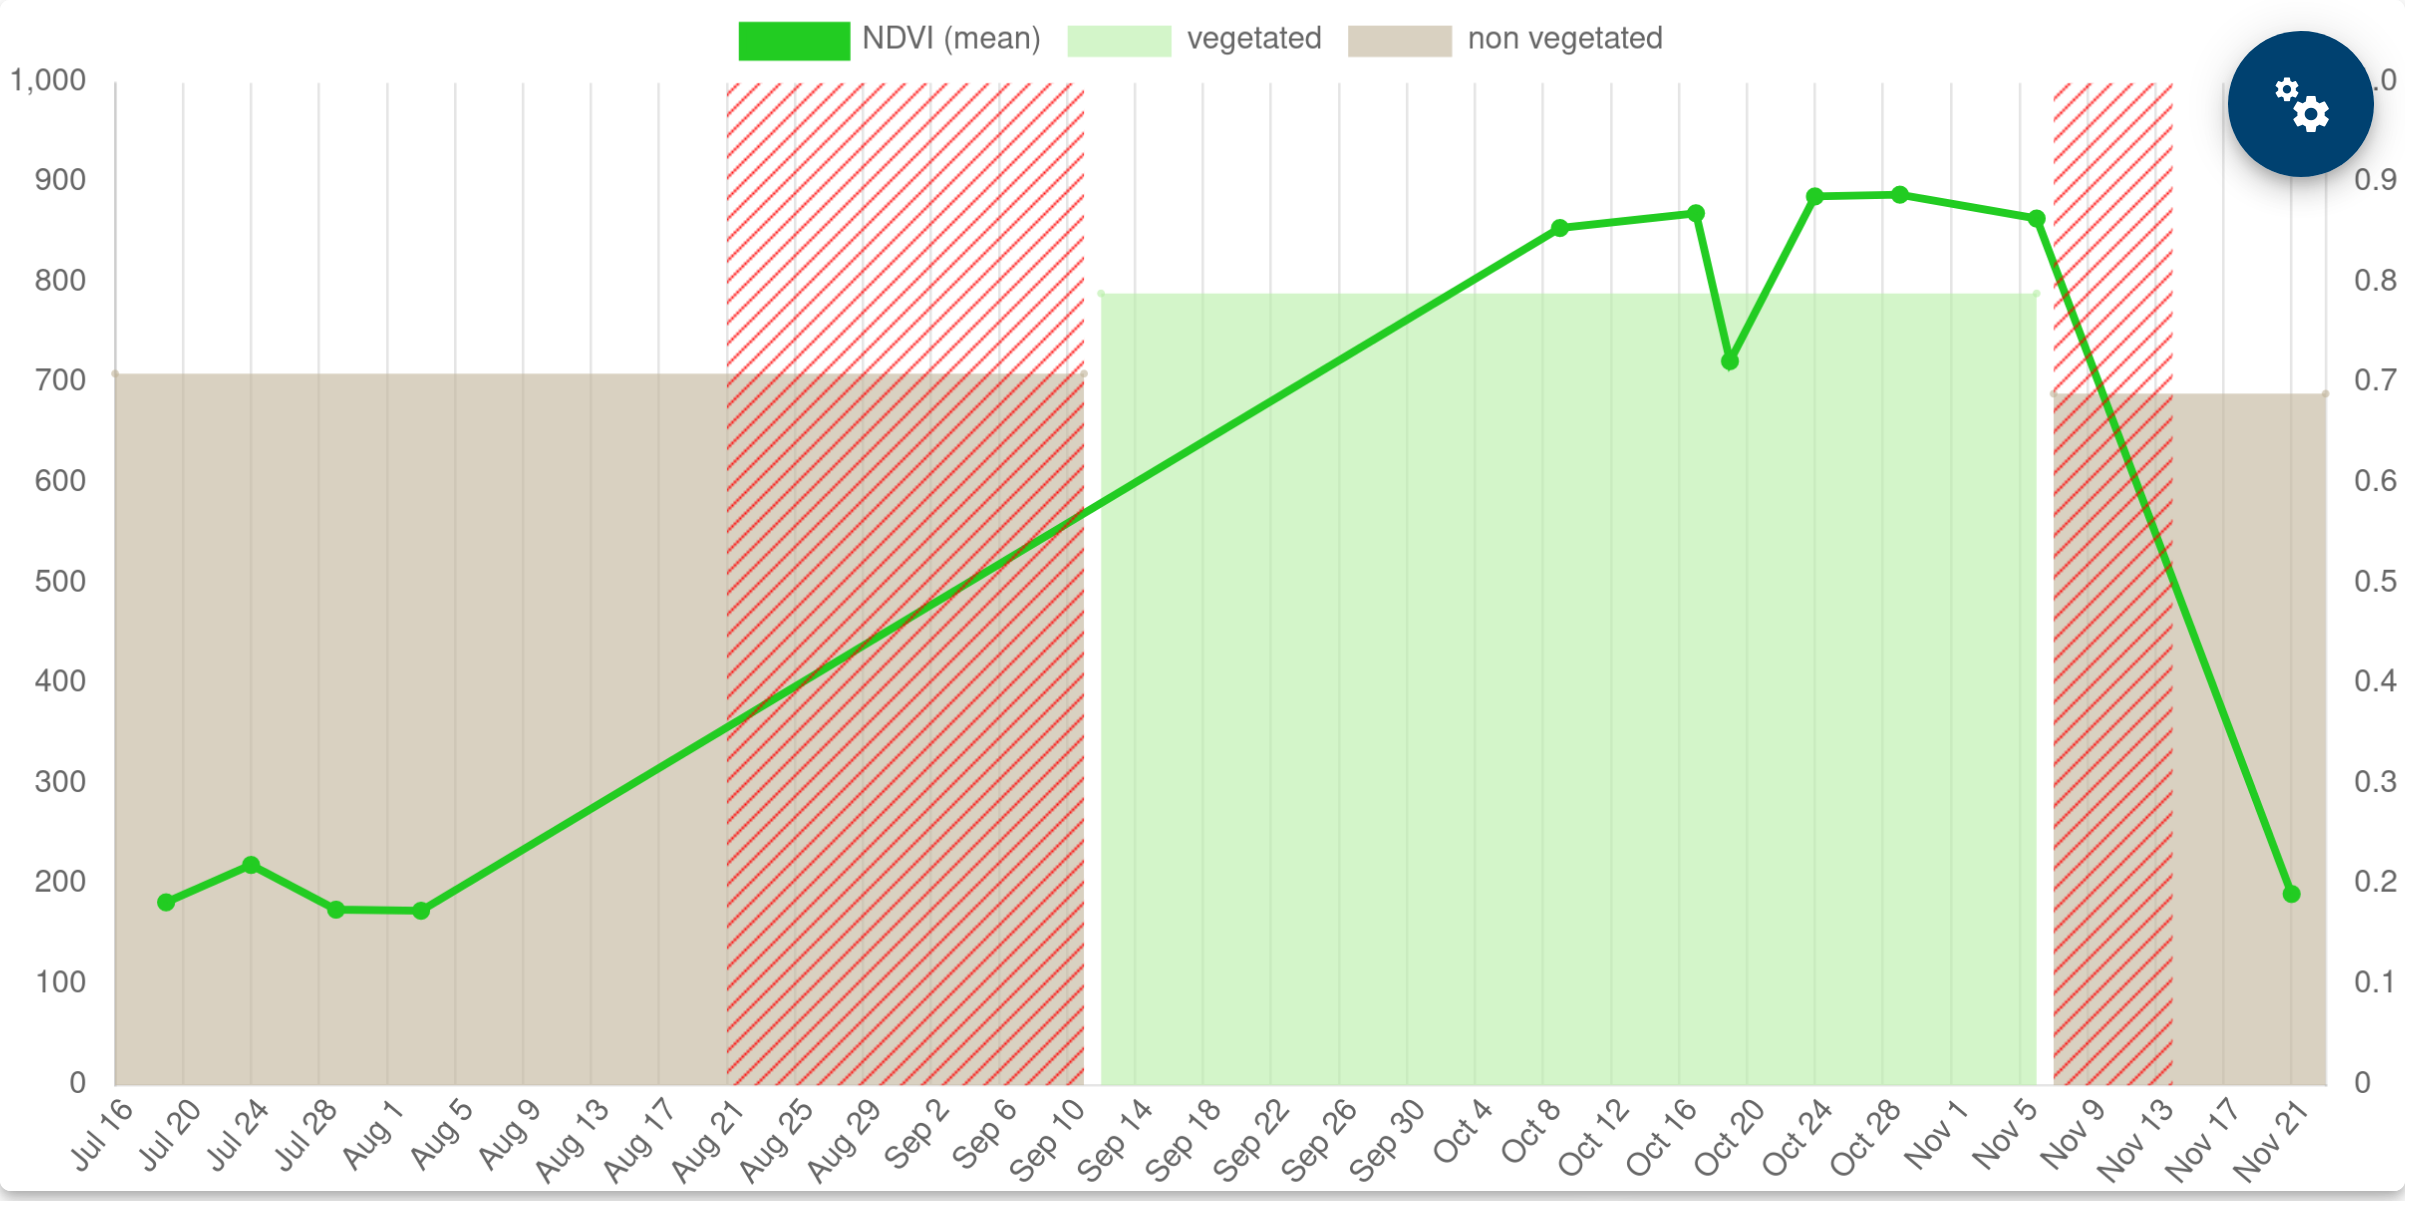
# Signals
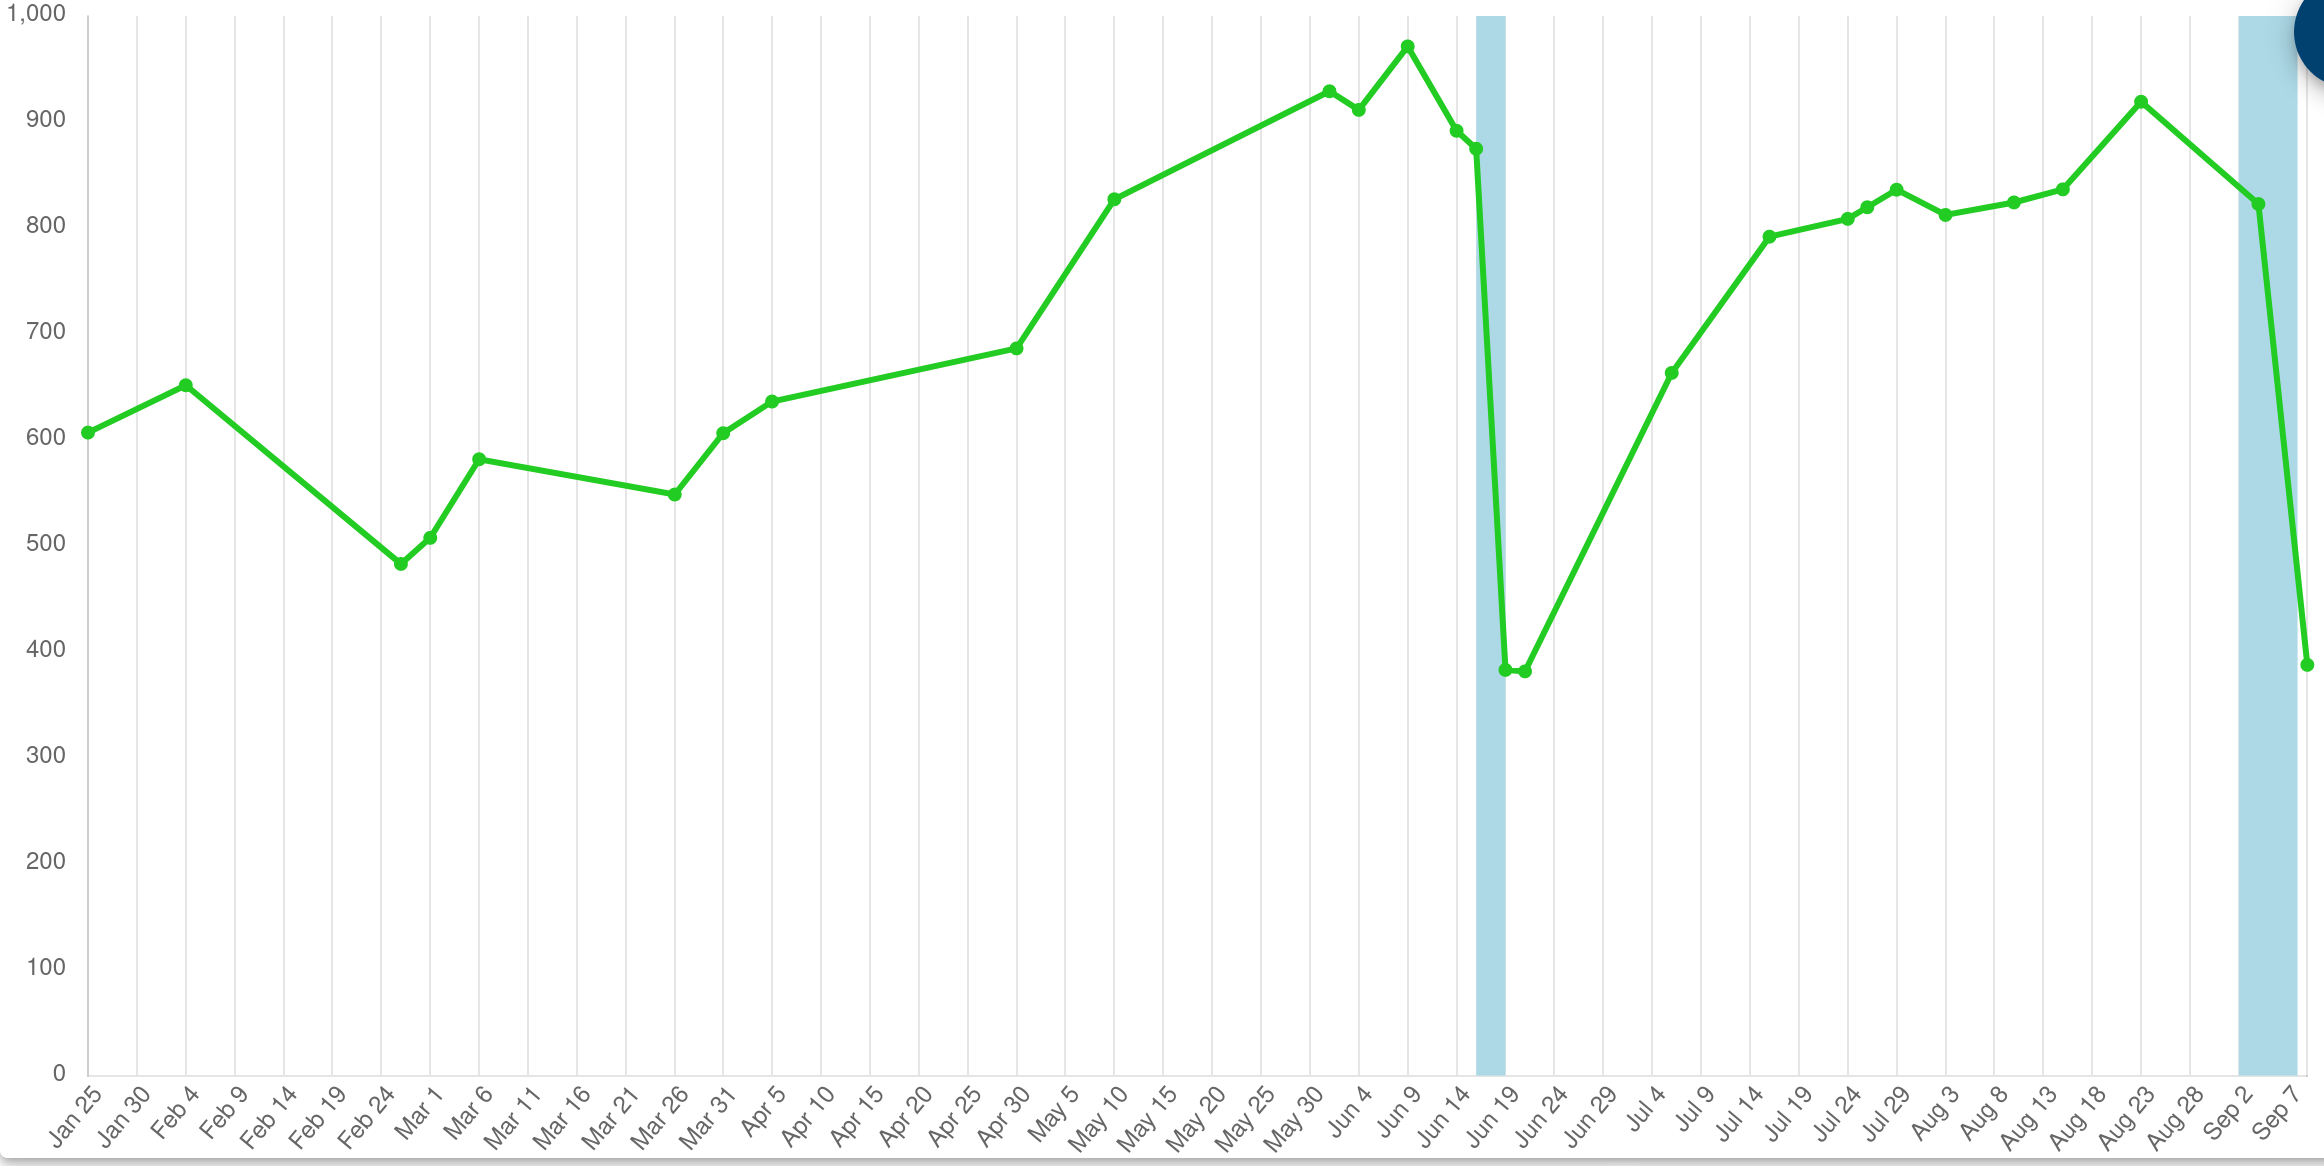
In the context of CbM signals are time series of spatially aggregated satellite data, making them a Level-3 satellite product. Examples are vegetation index (NDVI) or SAR backscatter curves. Such signals are both used to visually inspect the development of vegetation over an agricultural parcel and also serve as input to machine learning algorithms.
The most-common sources for signals are the Sentinel-1 and Sentinel-2 imagery. For parcels too small to be monitored with the Sentinels' spatial resolution, however, signals are derived from Planet Fusion or similar data products.
The signals for all agricultural parcels can be interactively explored in the chart widget of the AgriApp. Additionally, a web endpoint of JSON format is exposed to paying agencies, which can be used to integrate signals into internal paying agency tools.
# Markers
Derived from a signal, markers indicate a kind of farming practice or vegetation change on a parcel at a given time during the agricultural season. For example, machine learning algorithms are able to detect harvest or mowing events by searching for signal drops in the vegetation index time series.
The EO-WIDGET architecture is not constrained to any algorithm provider—several kinds of algorithms have already been integrated successfully into our agri workspace.
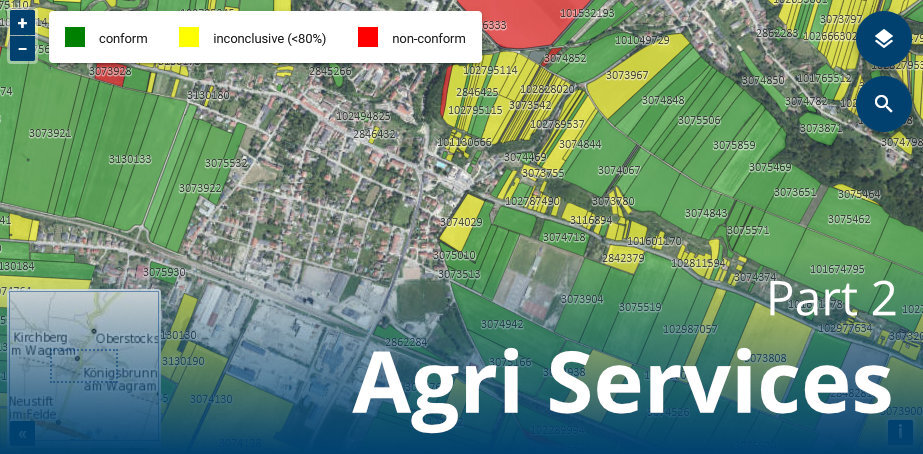
# Compliance Results
Our agri workspace is also the place where compliance rules as provided by the paying agency are evaluated. The paying agency can define requirements a parcel has to meet in compliance with a specific payment scheme.
For example, one crop type must be mowed at least once and at the most twice. If a specific parcel's markers show compliance with this rule, the parcel is annotated with a "compliant" flag. If not, "non-compliant" is annotated.
In some cases the algorithm cannot take a confident decision based on the input data presented to it. Such parcels are flagged as "inconclusive" and delegated for decision by a human operator.
# Business Decisions
A batch of "inconclusive" parcels can be assigned to an operator. This batch will be added to an interactive to-do list. For each parcel in the list the operator can make a decision based on the signals and markers and auxiliary information such as satellite imagery, on-the-spot-checks commentary, etc.
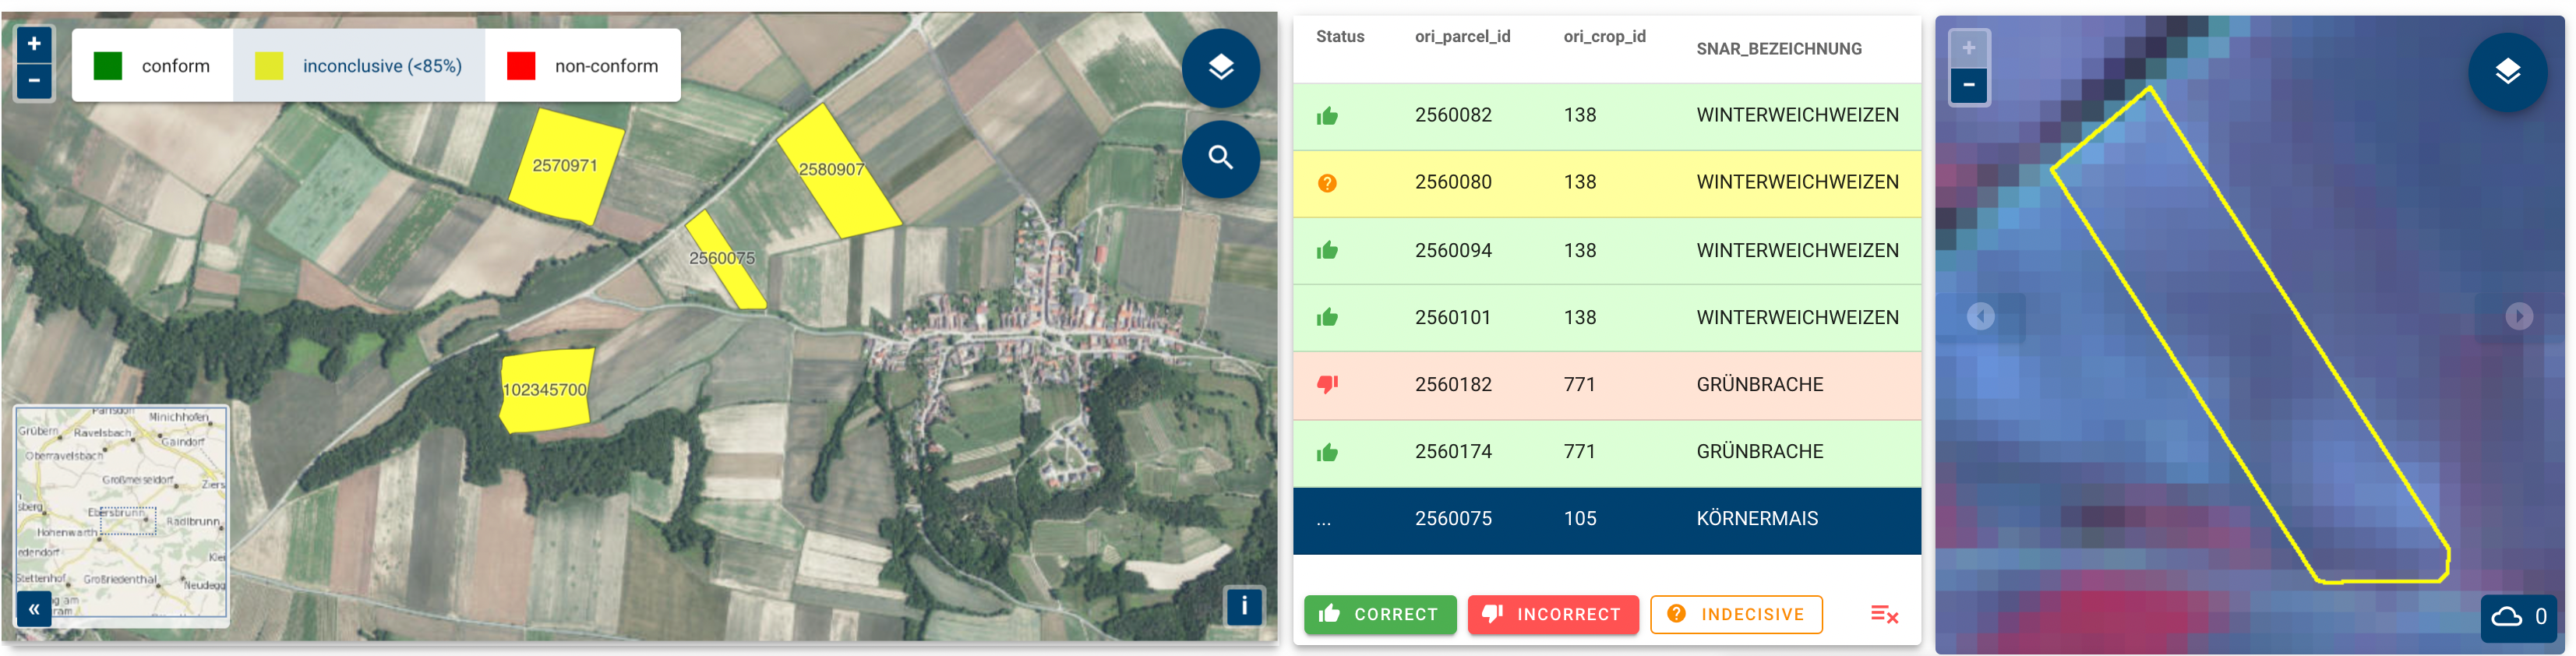
These human decisions are also stored in the agri database and are prepared to be imported into the paying agency's system via defined interfaces, together with any other information gathered in the AMS process.
# Conclusion
EOX strives to build an open value chain for the Area Monitoring System. Therefore our agri workspace can interface with a diverse set of input data and algorithm providers. All processing results such as signals and markers, as well as compliance values and business decisions are readily available to the paying agency in the form of on-demand access and batch data transfers.
# Agri Blogpost Series
This blogpost is part of a multi-post series. Stay tuned for part 3 of this blog post series, where you will learn about the data pipelines that interface with the paying agency and algorithm providers. You will also find out how to get on board and benefit from the open-value-chain AMS.