Sentinel-2 Product Density Maps
Big things have small beginnings, working with Earth observation data is no exception. Providing, distributing, visualizing, interpreting, and much more are only a few activities connected to the topic. It takes numerous steps to create a comprehensible output out of a pile of data. Some of the tasks might even take thousands of hours to complete and sometimes even after such a tremendous effort, projects still might be in their initial phase. So how to deal with the big data (opens new window) before you actually start shoveling it one terabyte at a time?
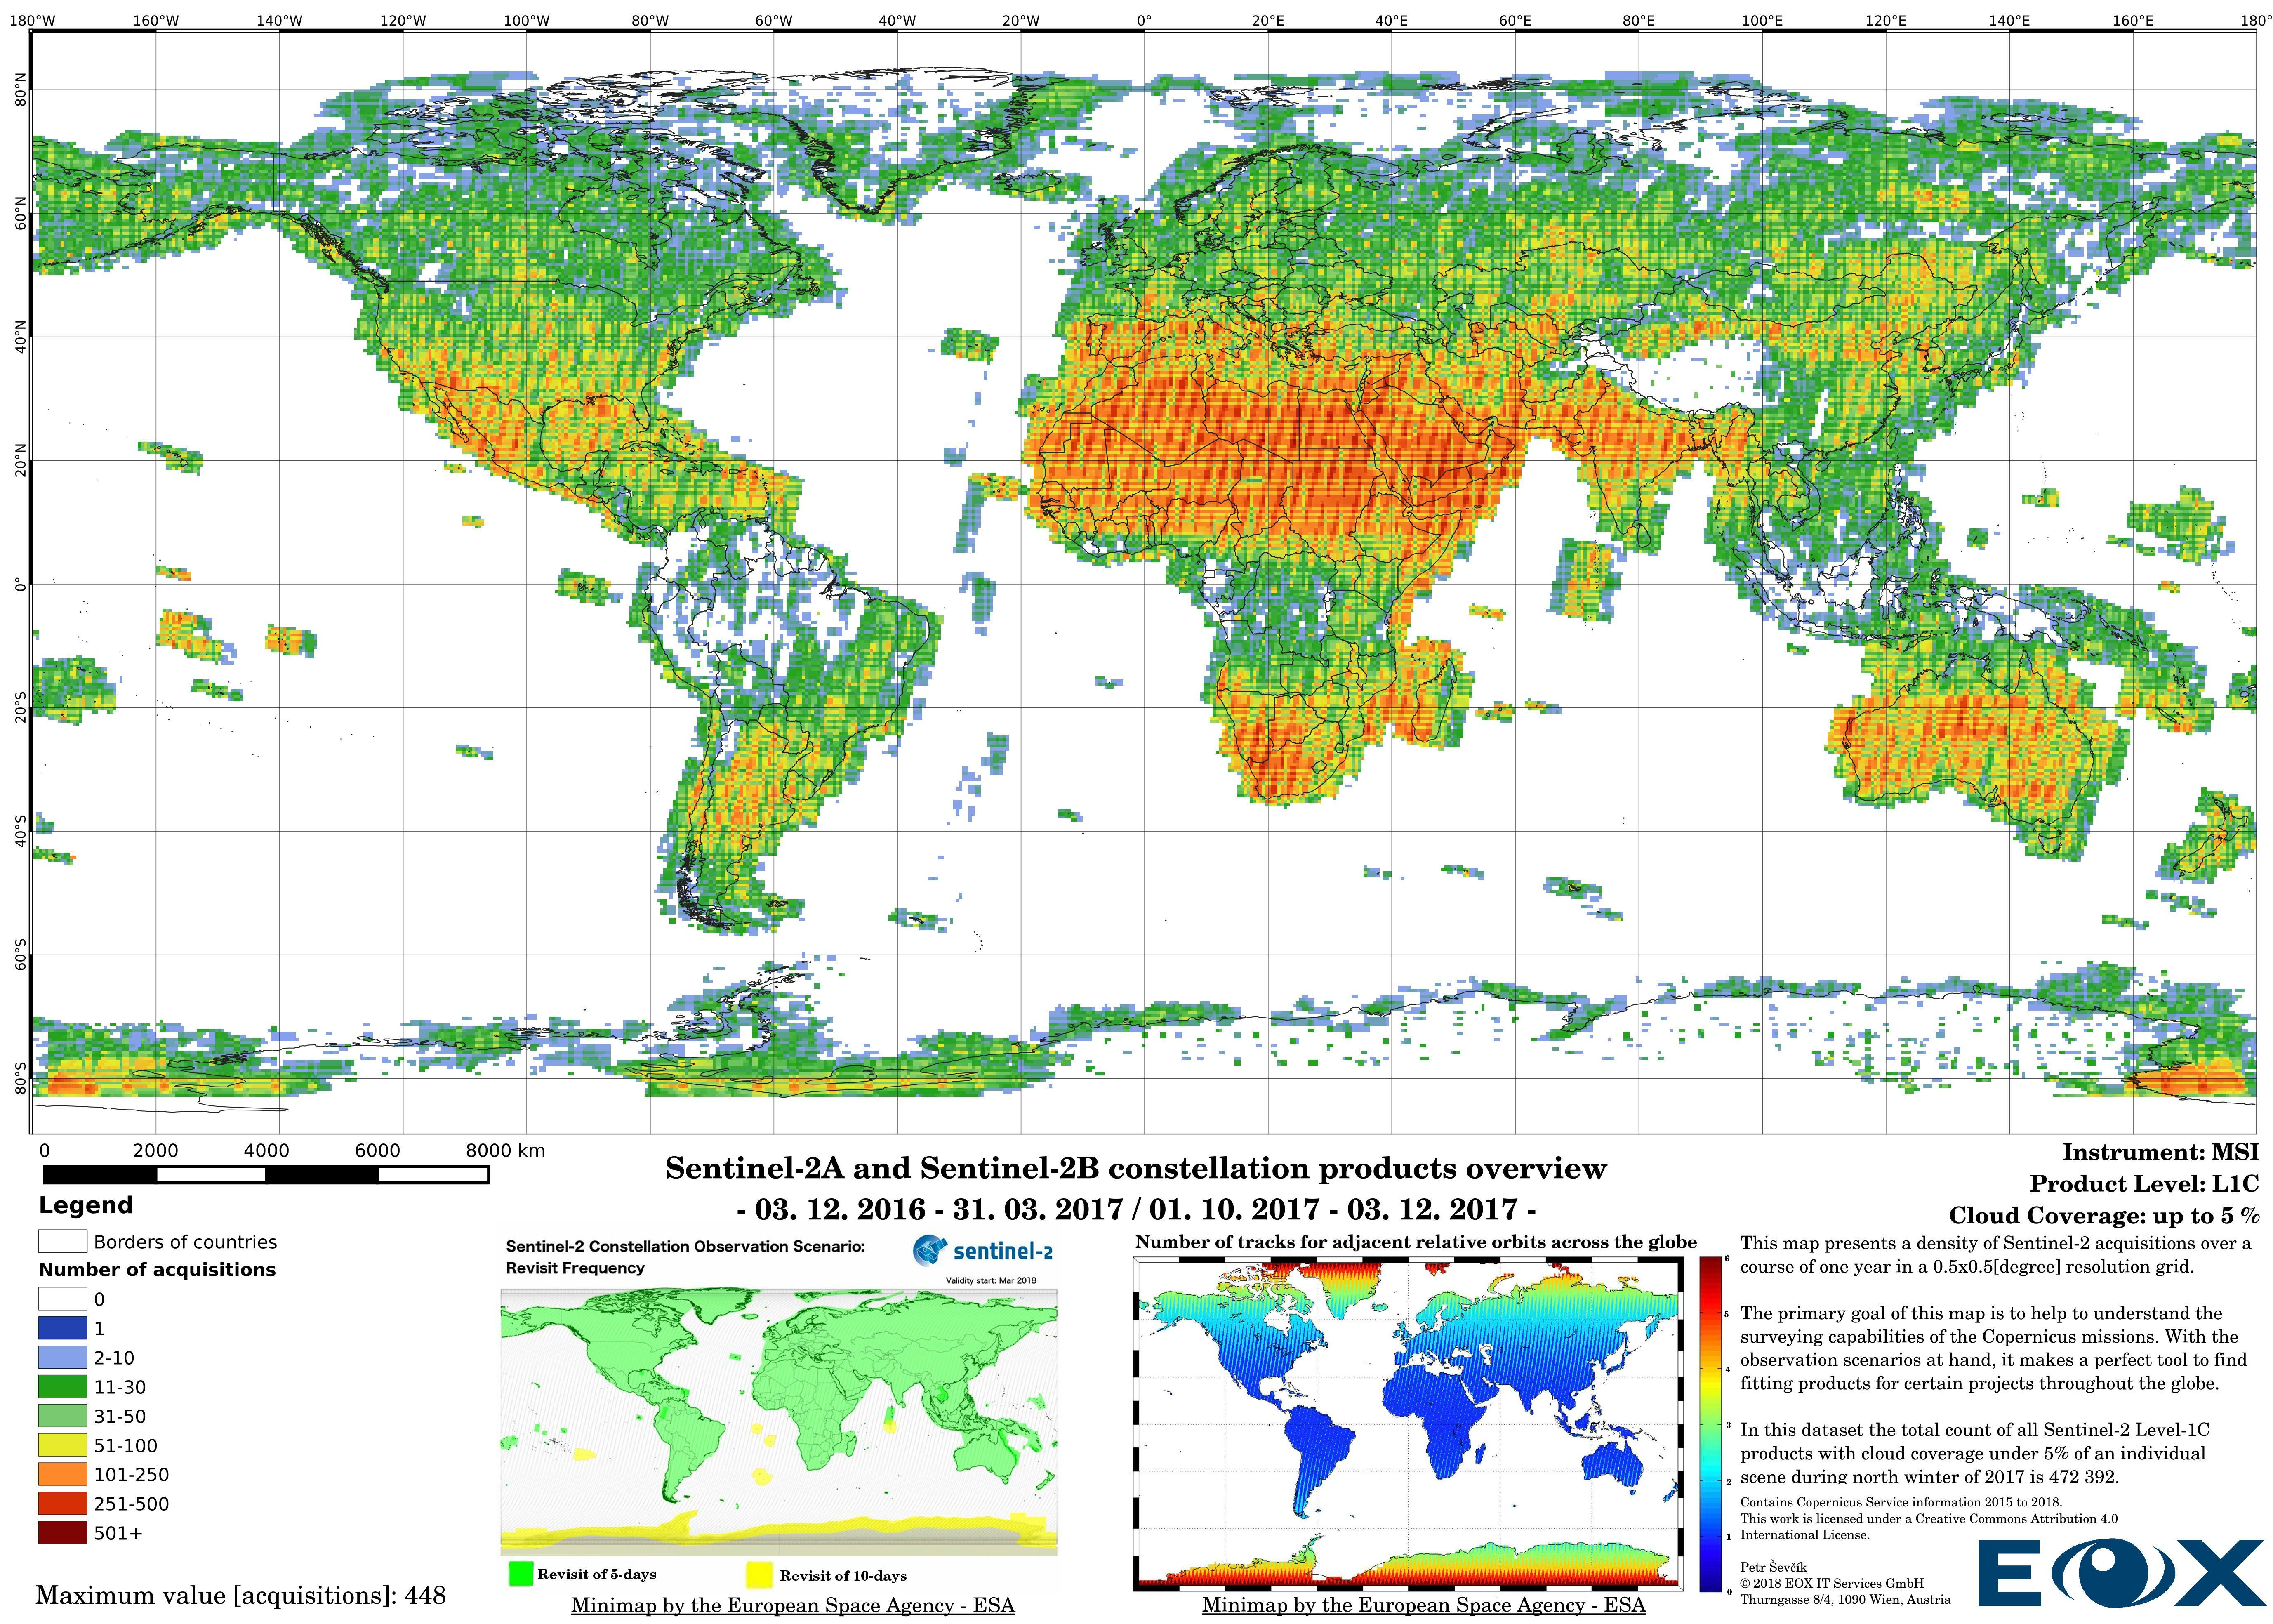
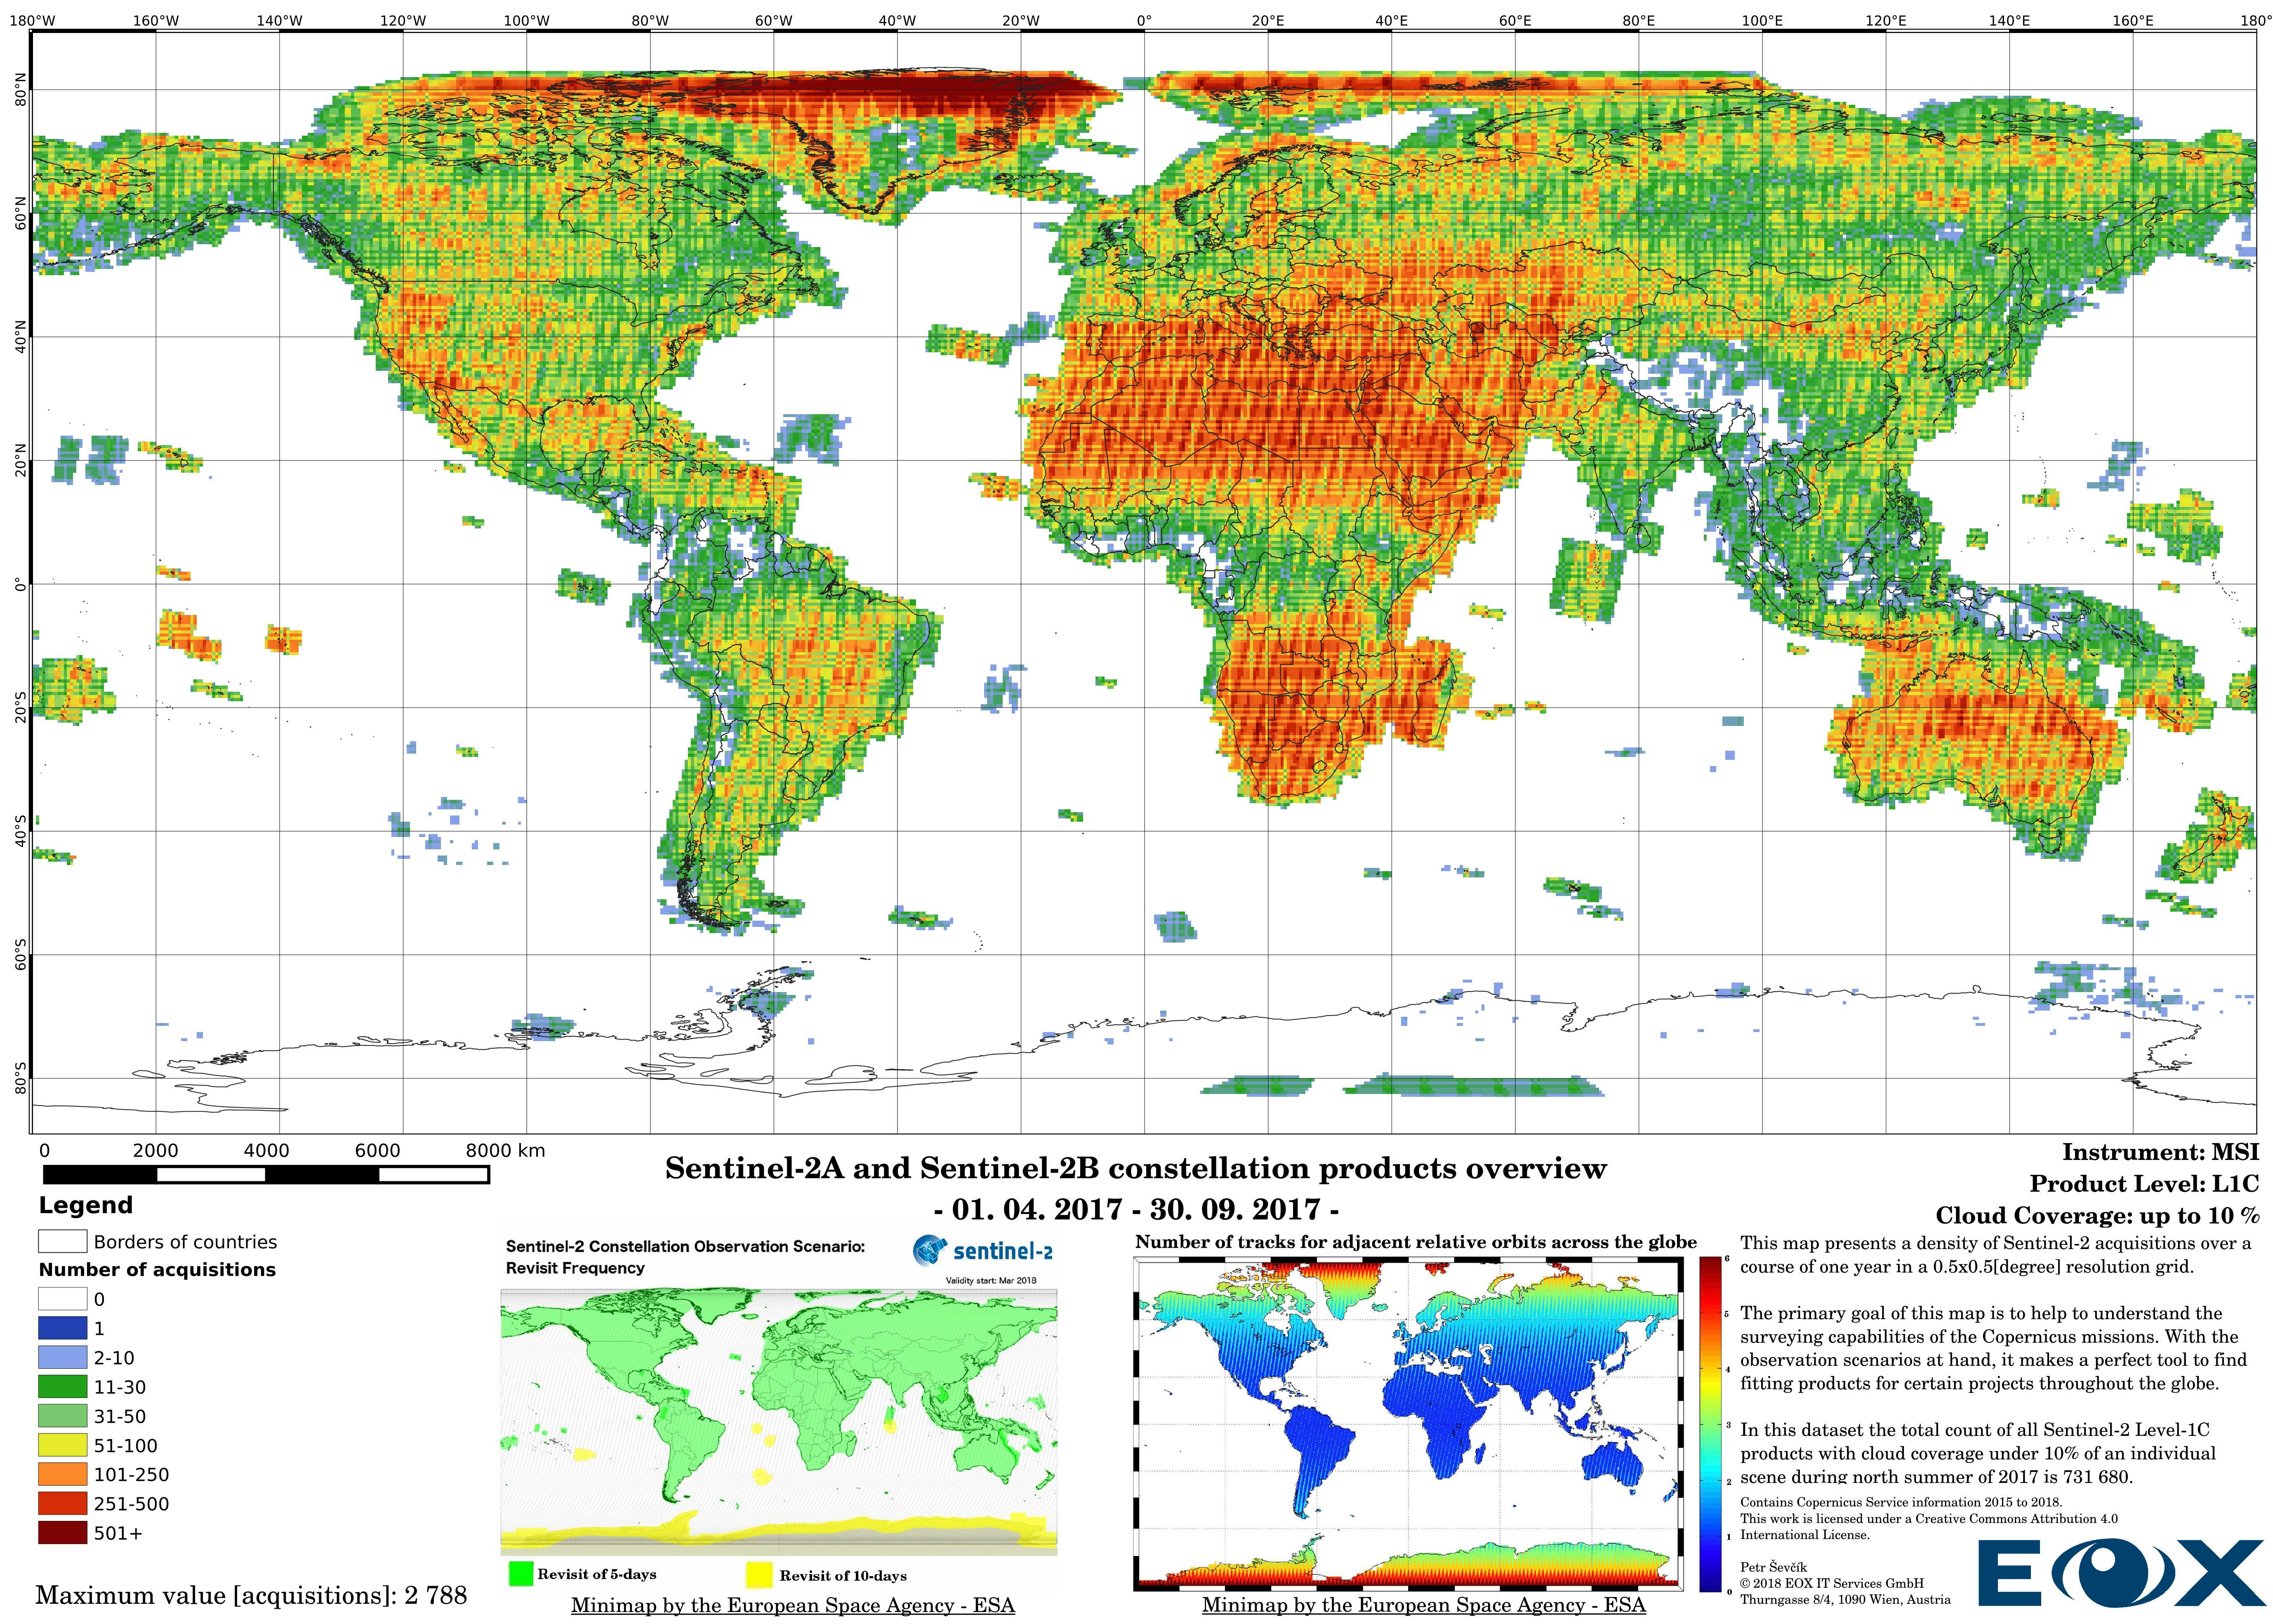
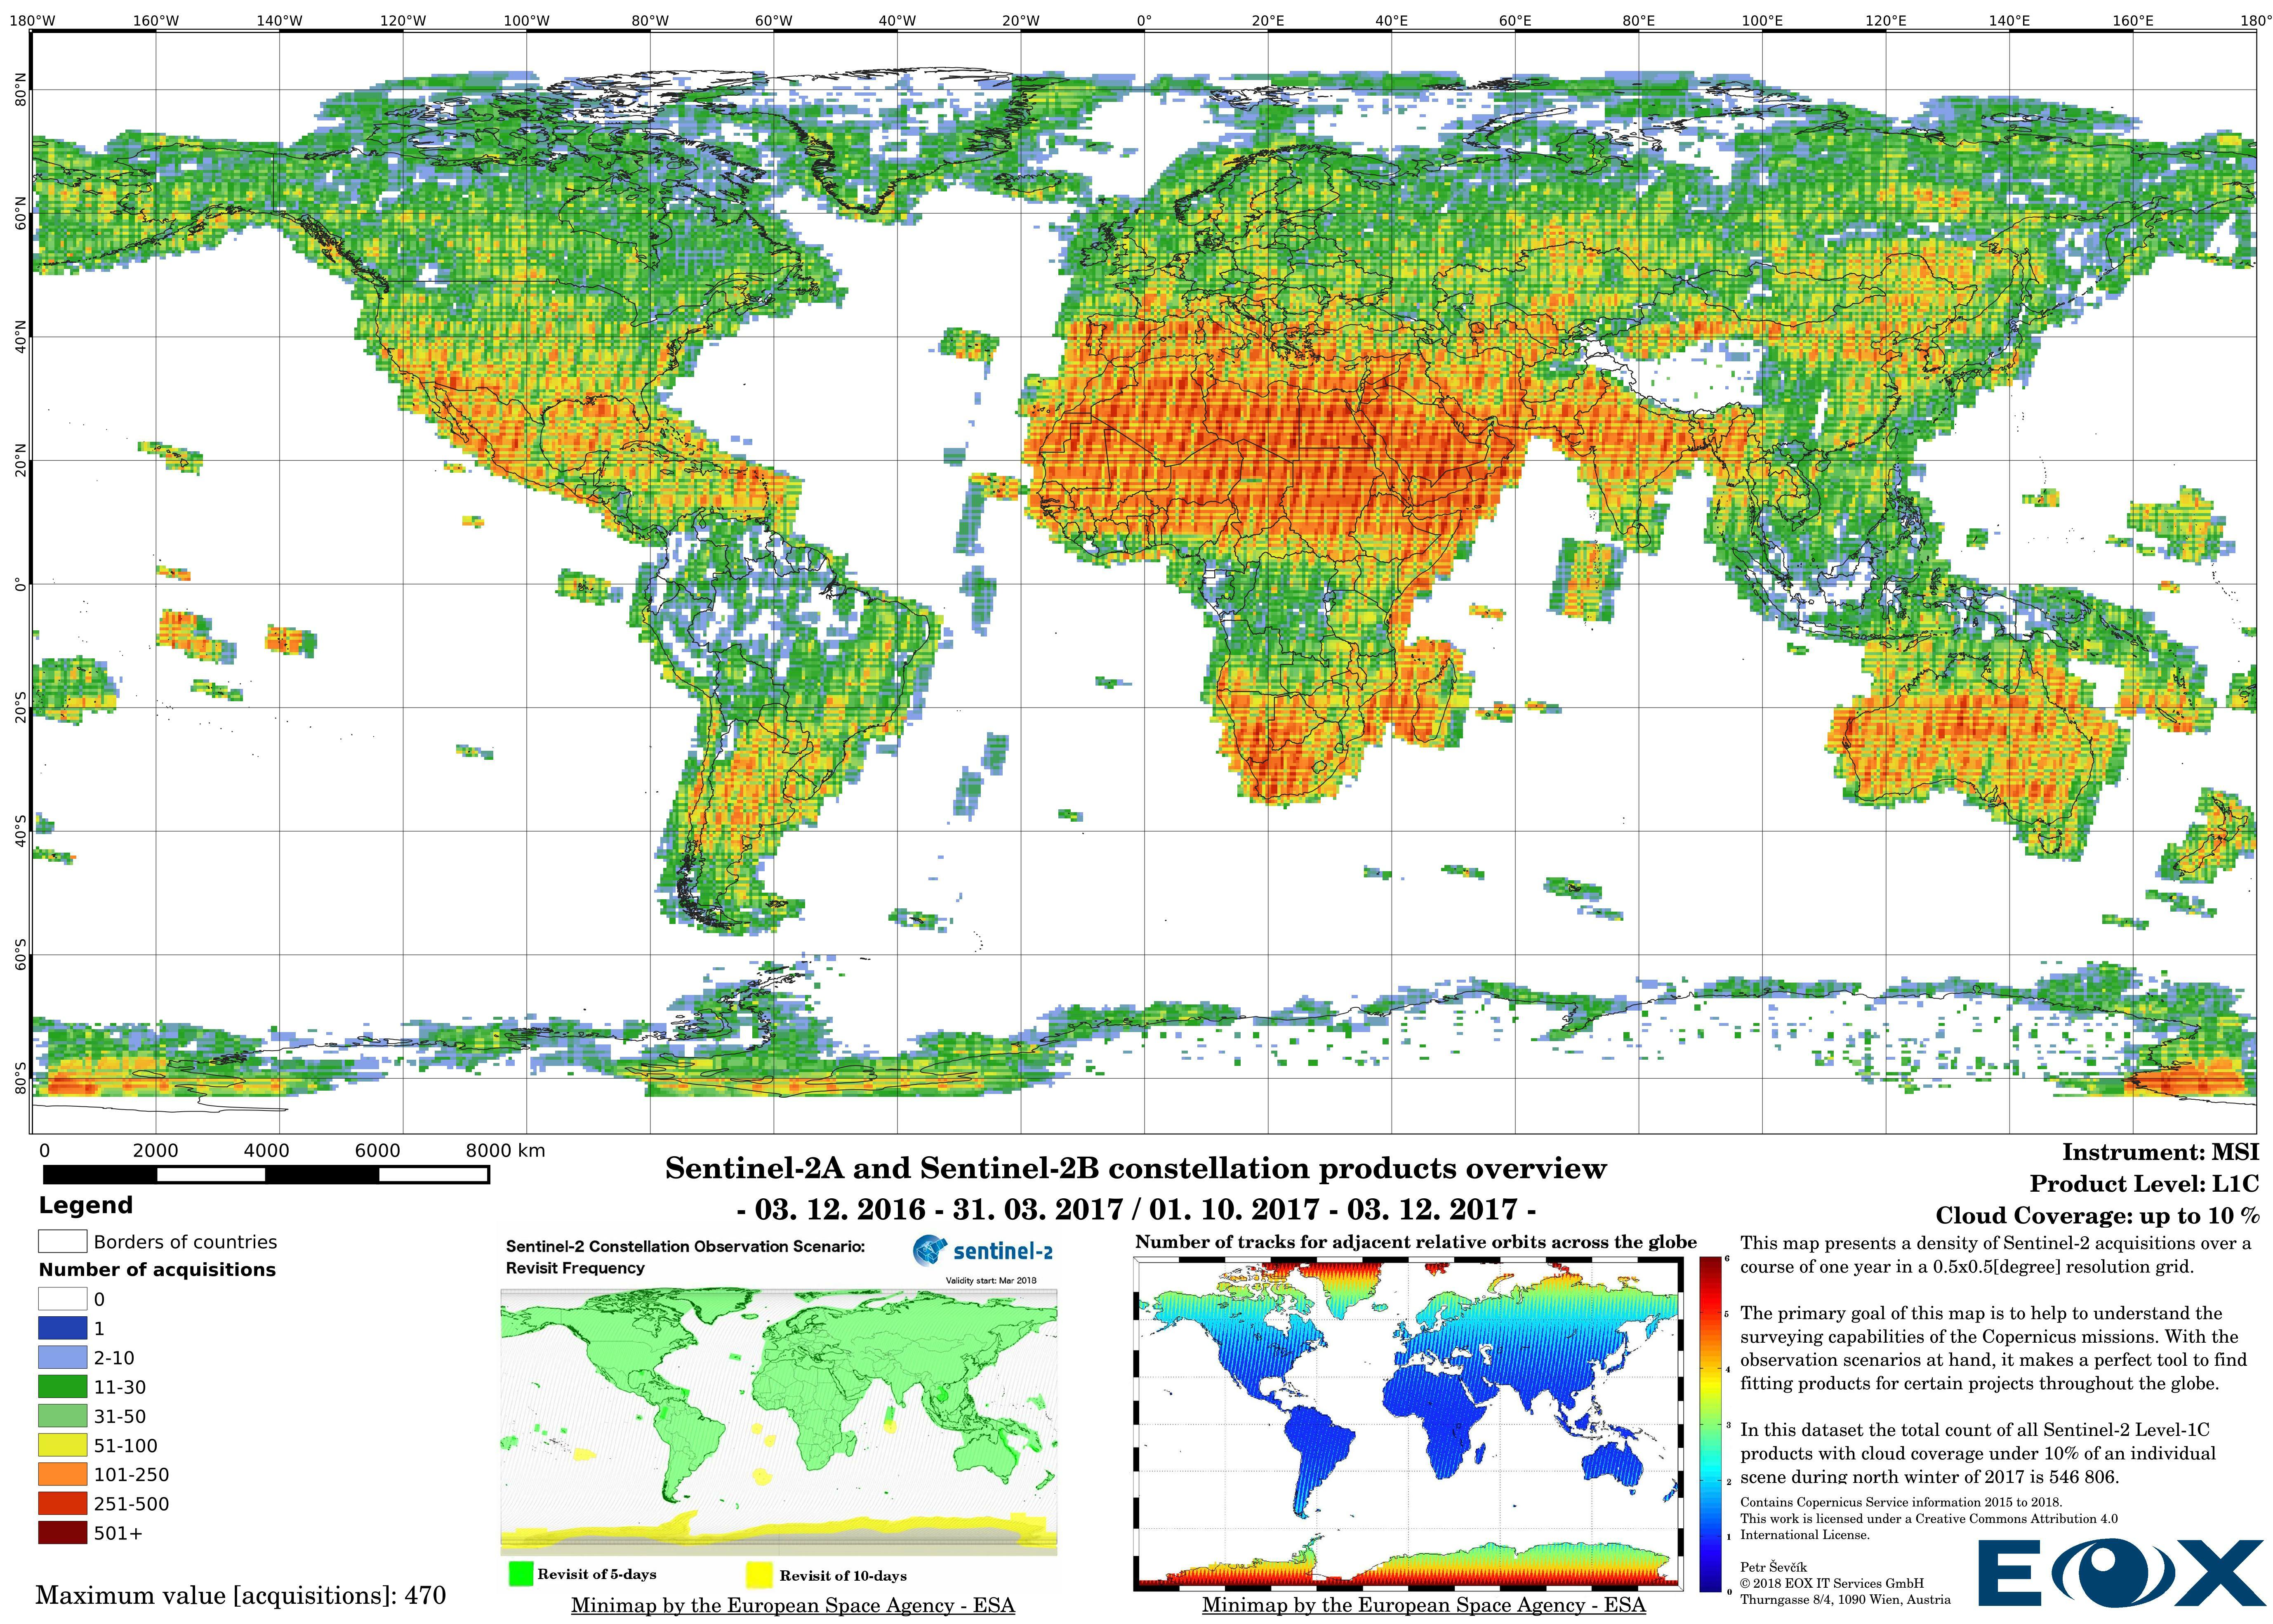
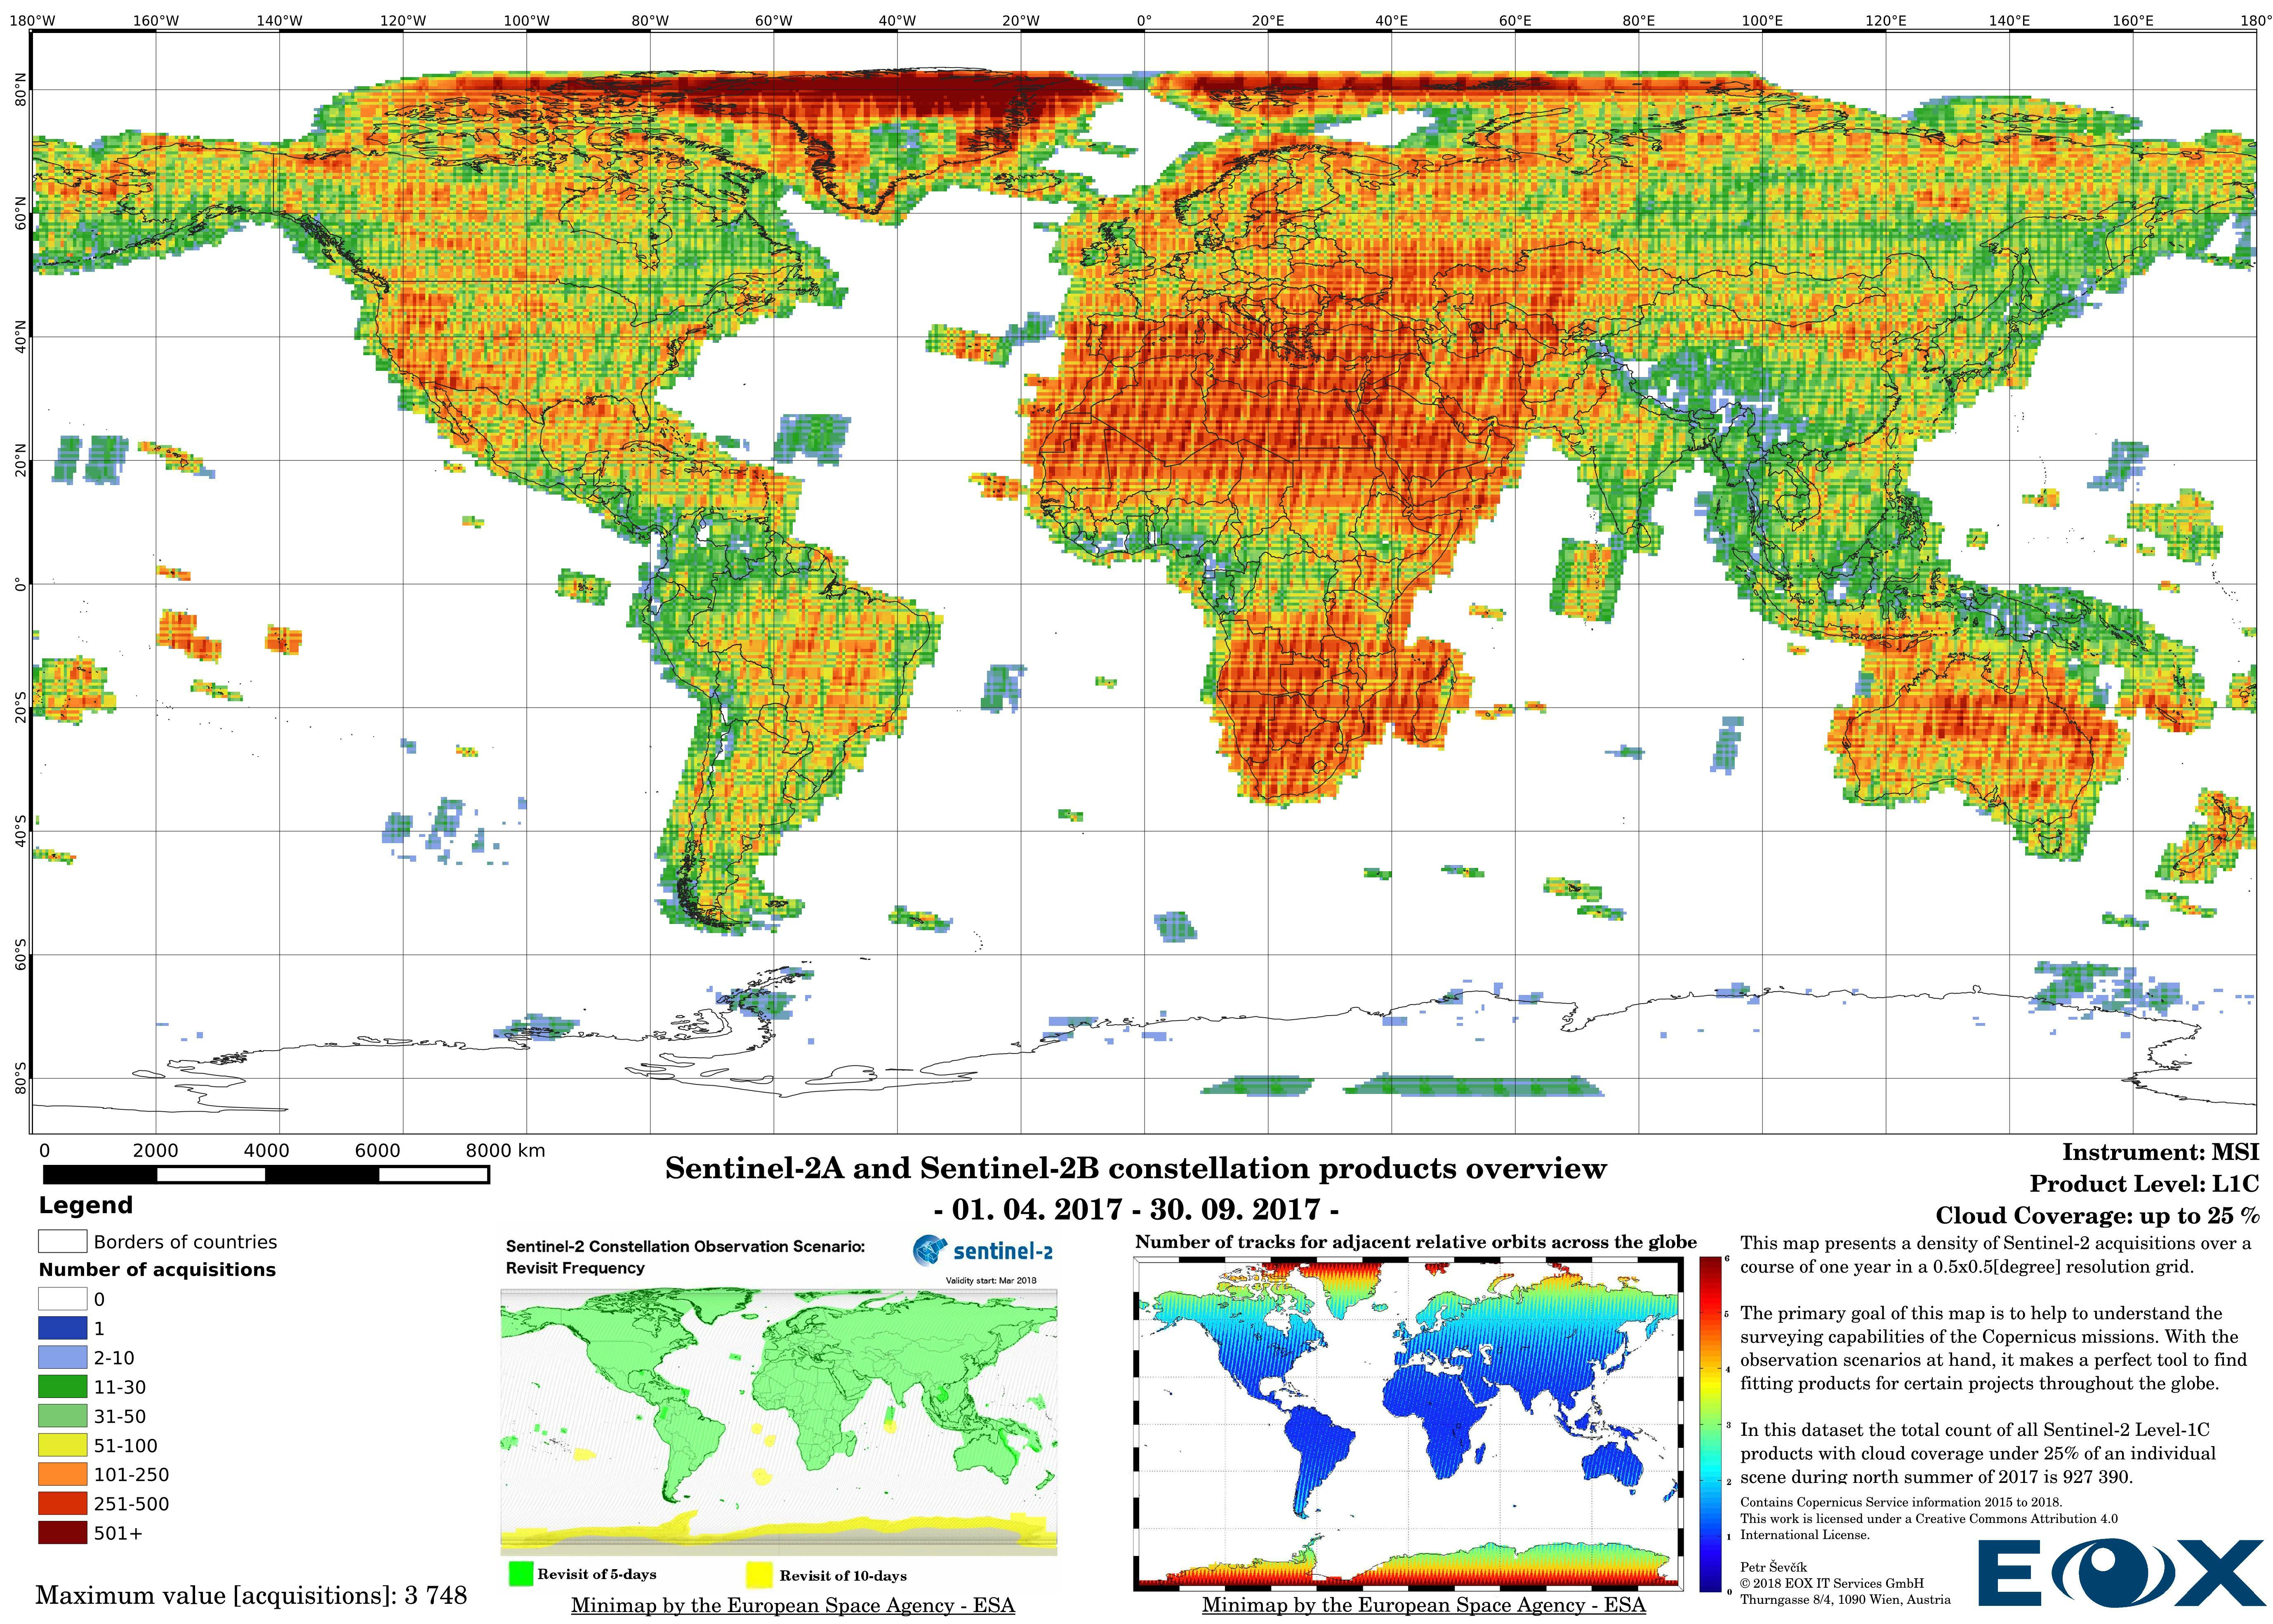
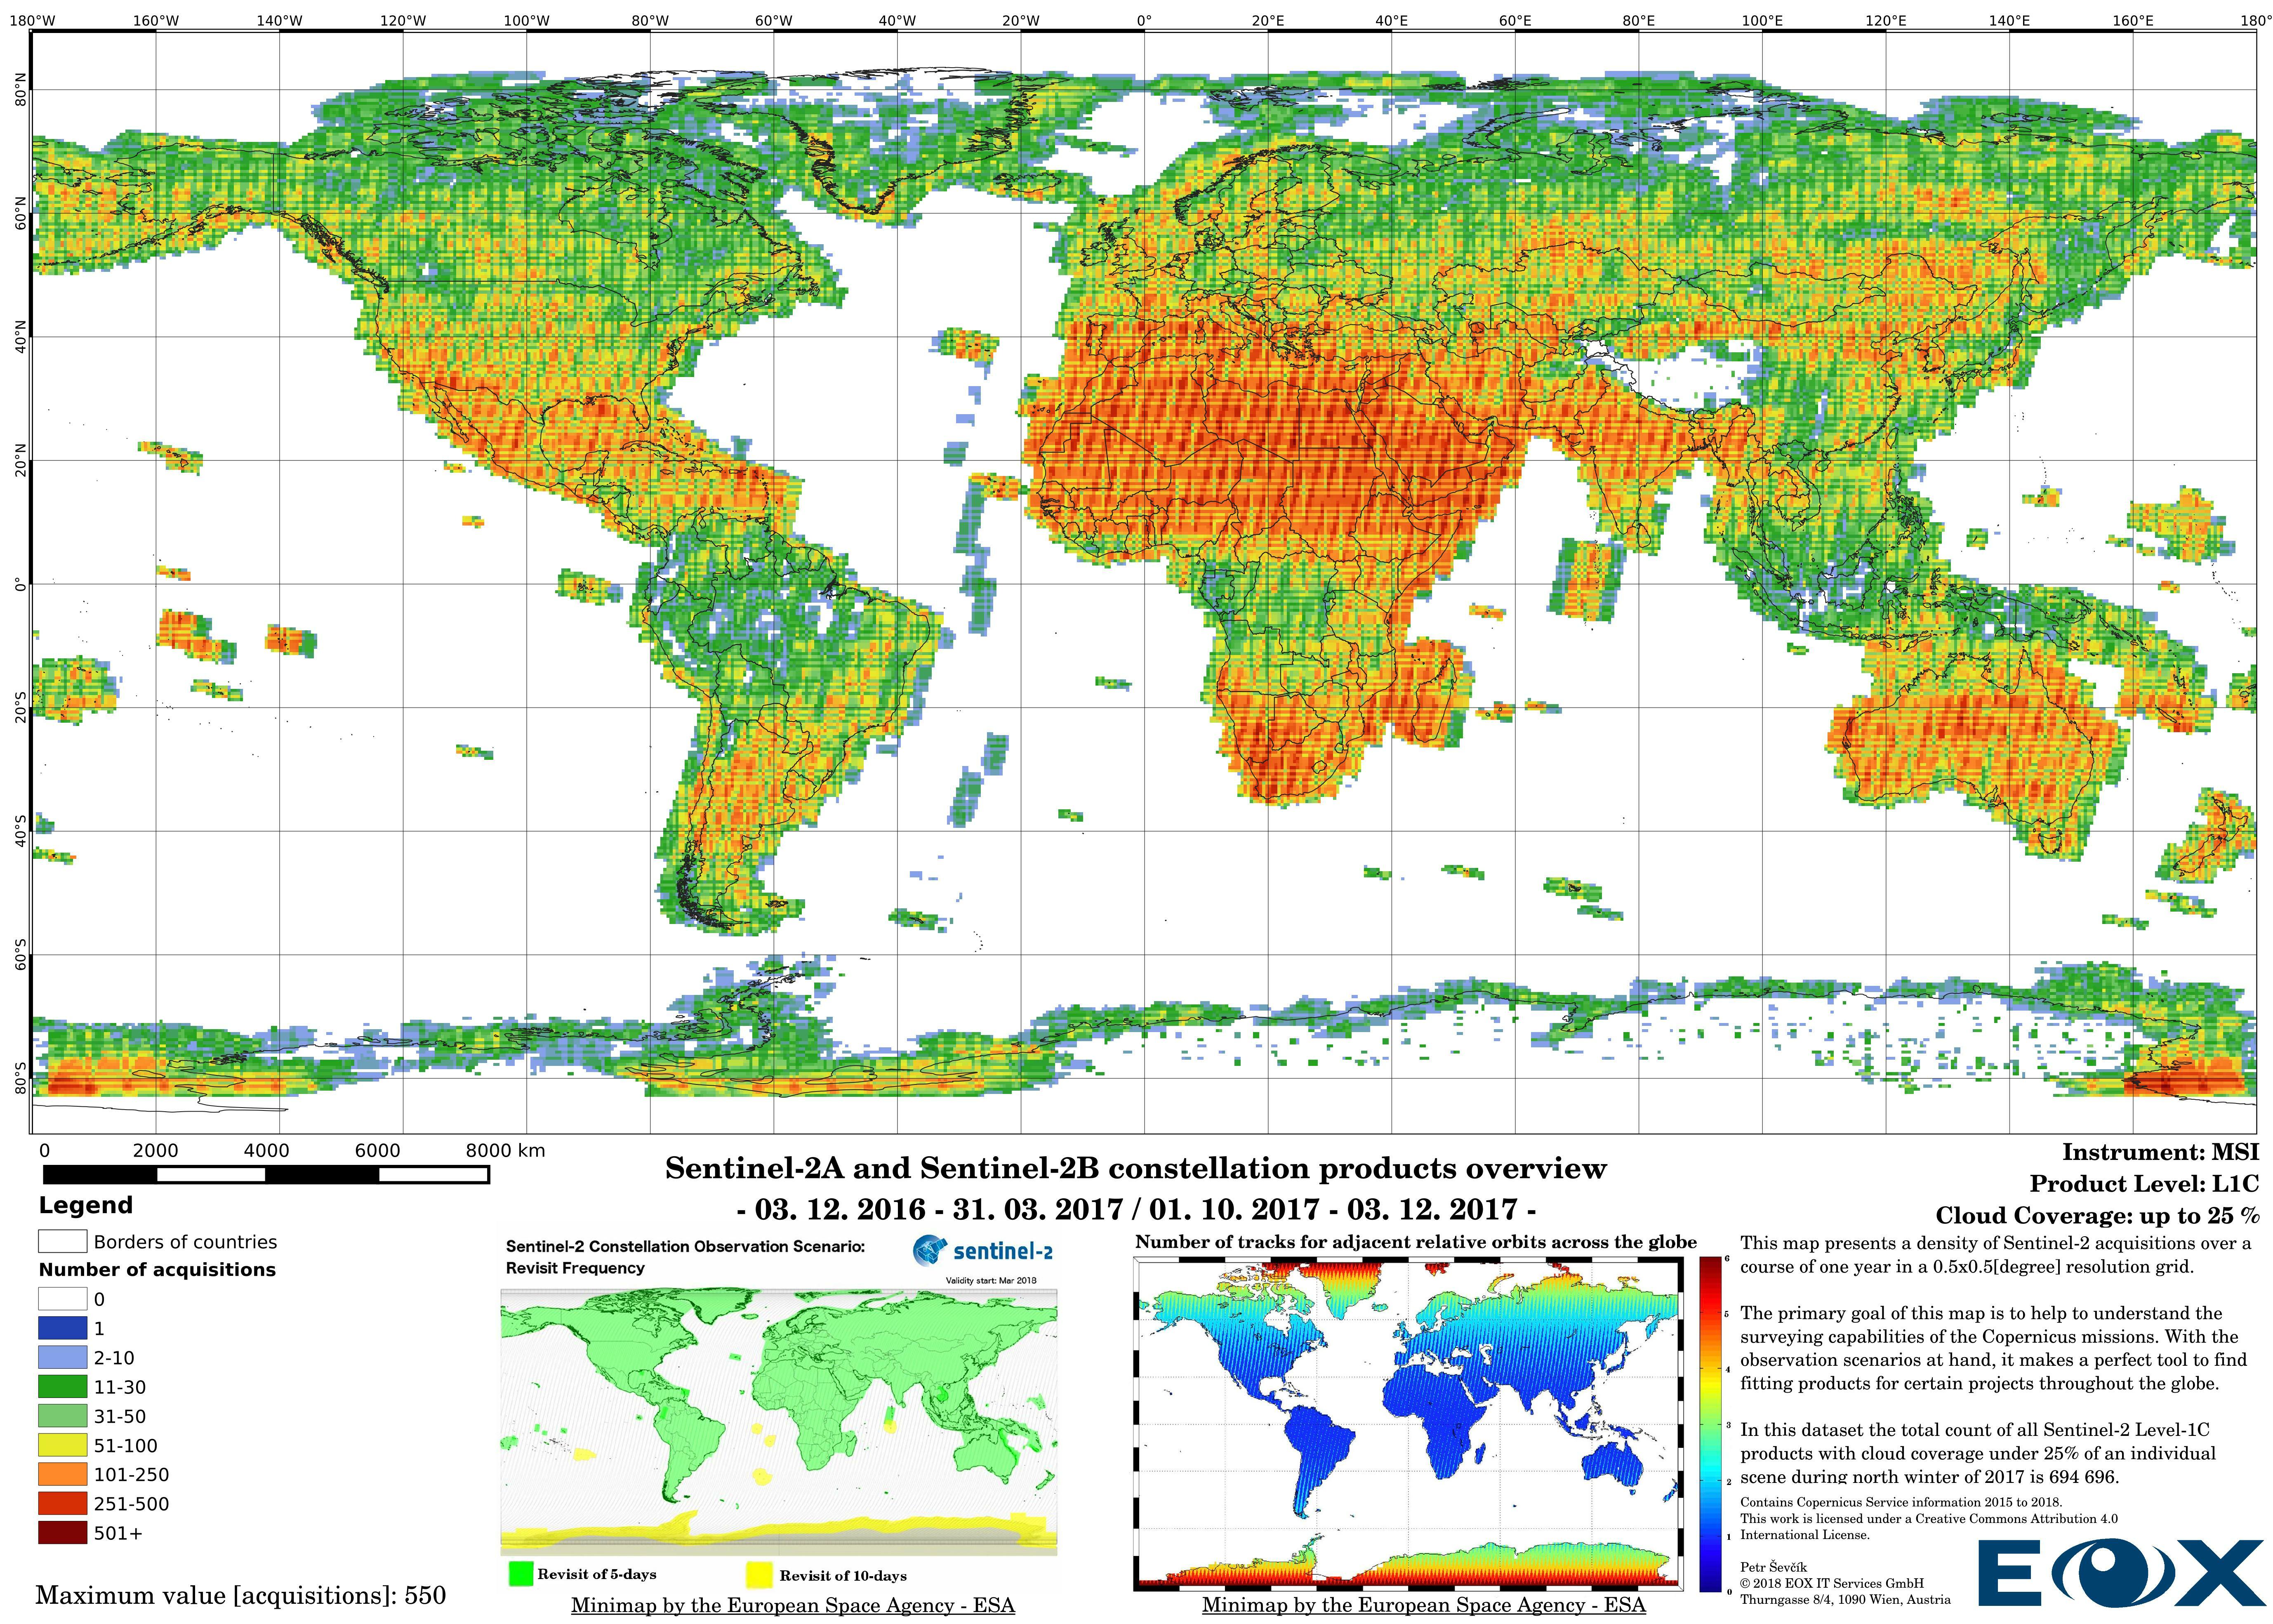
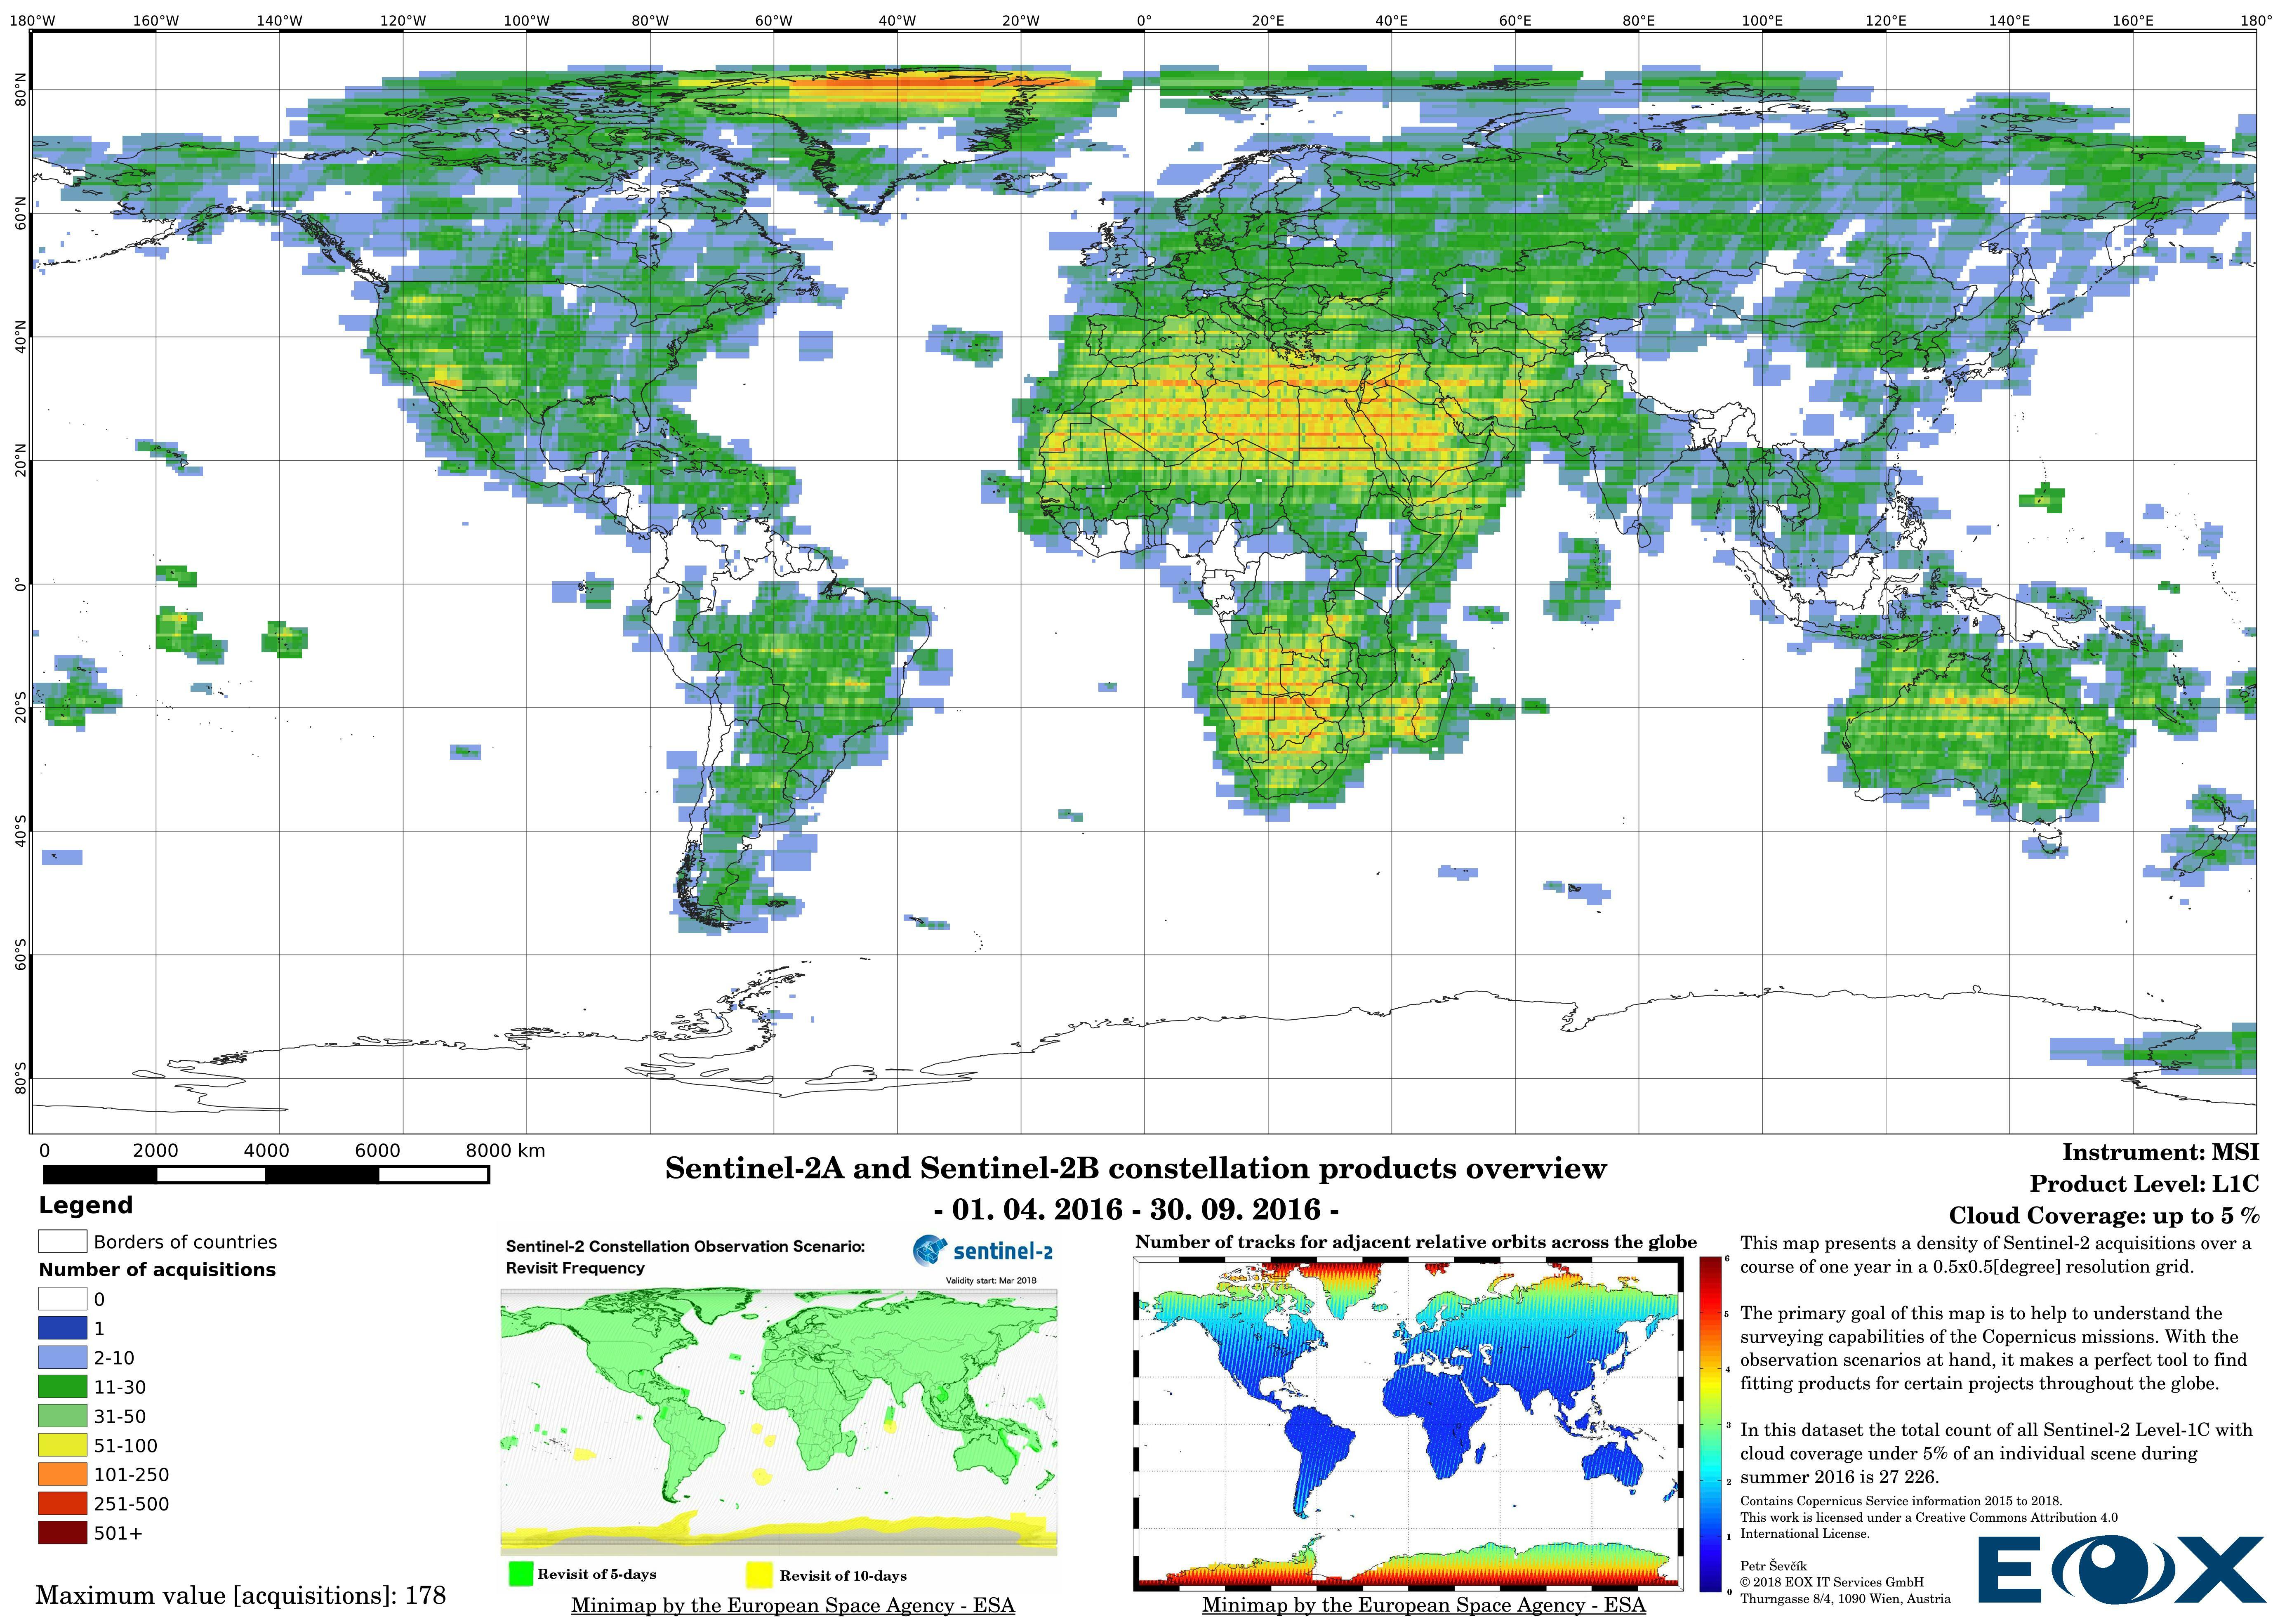
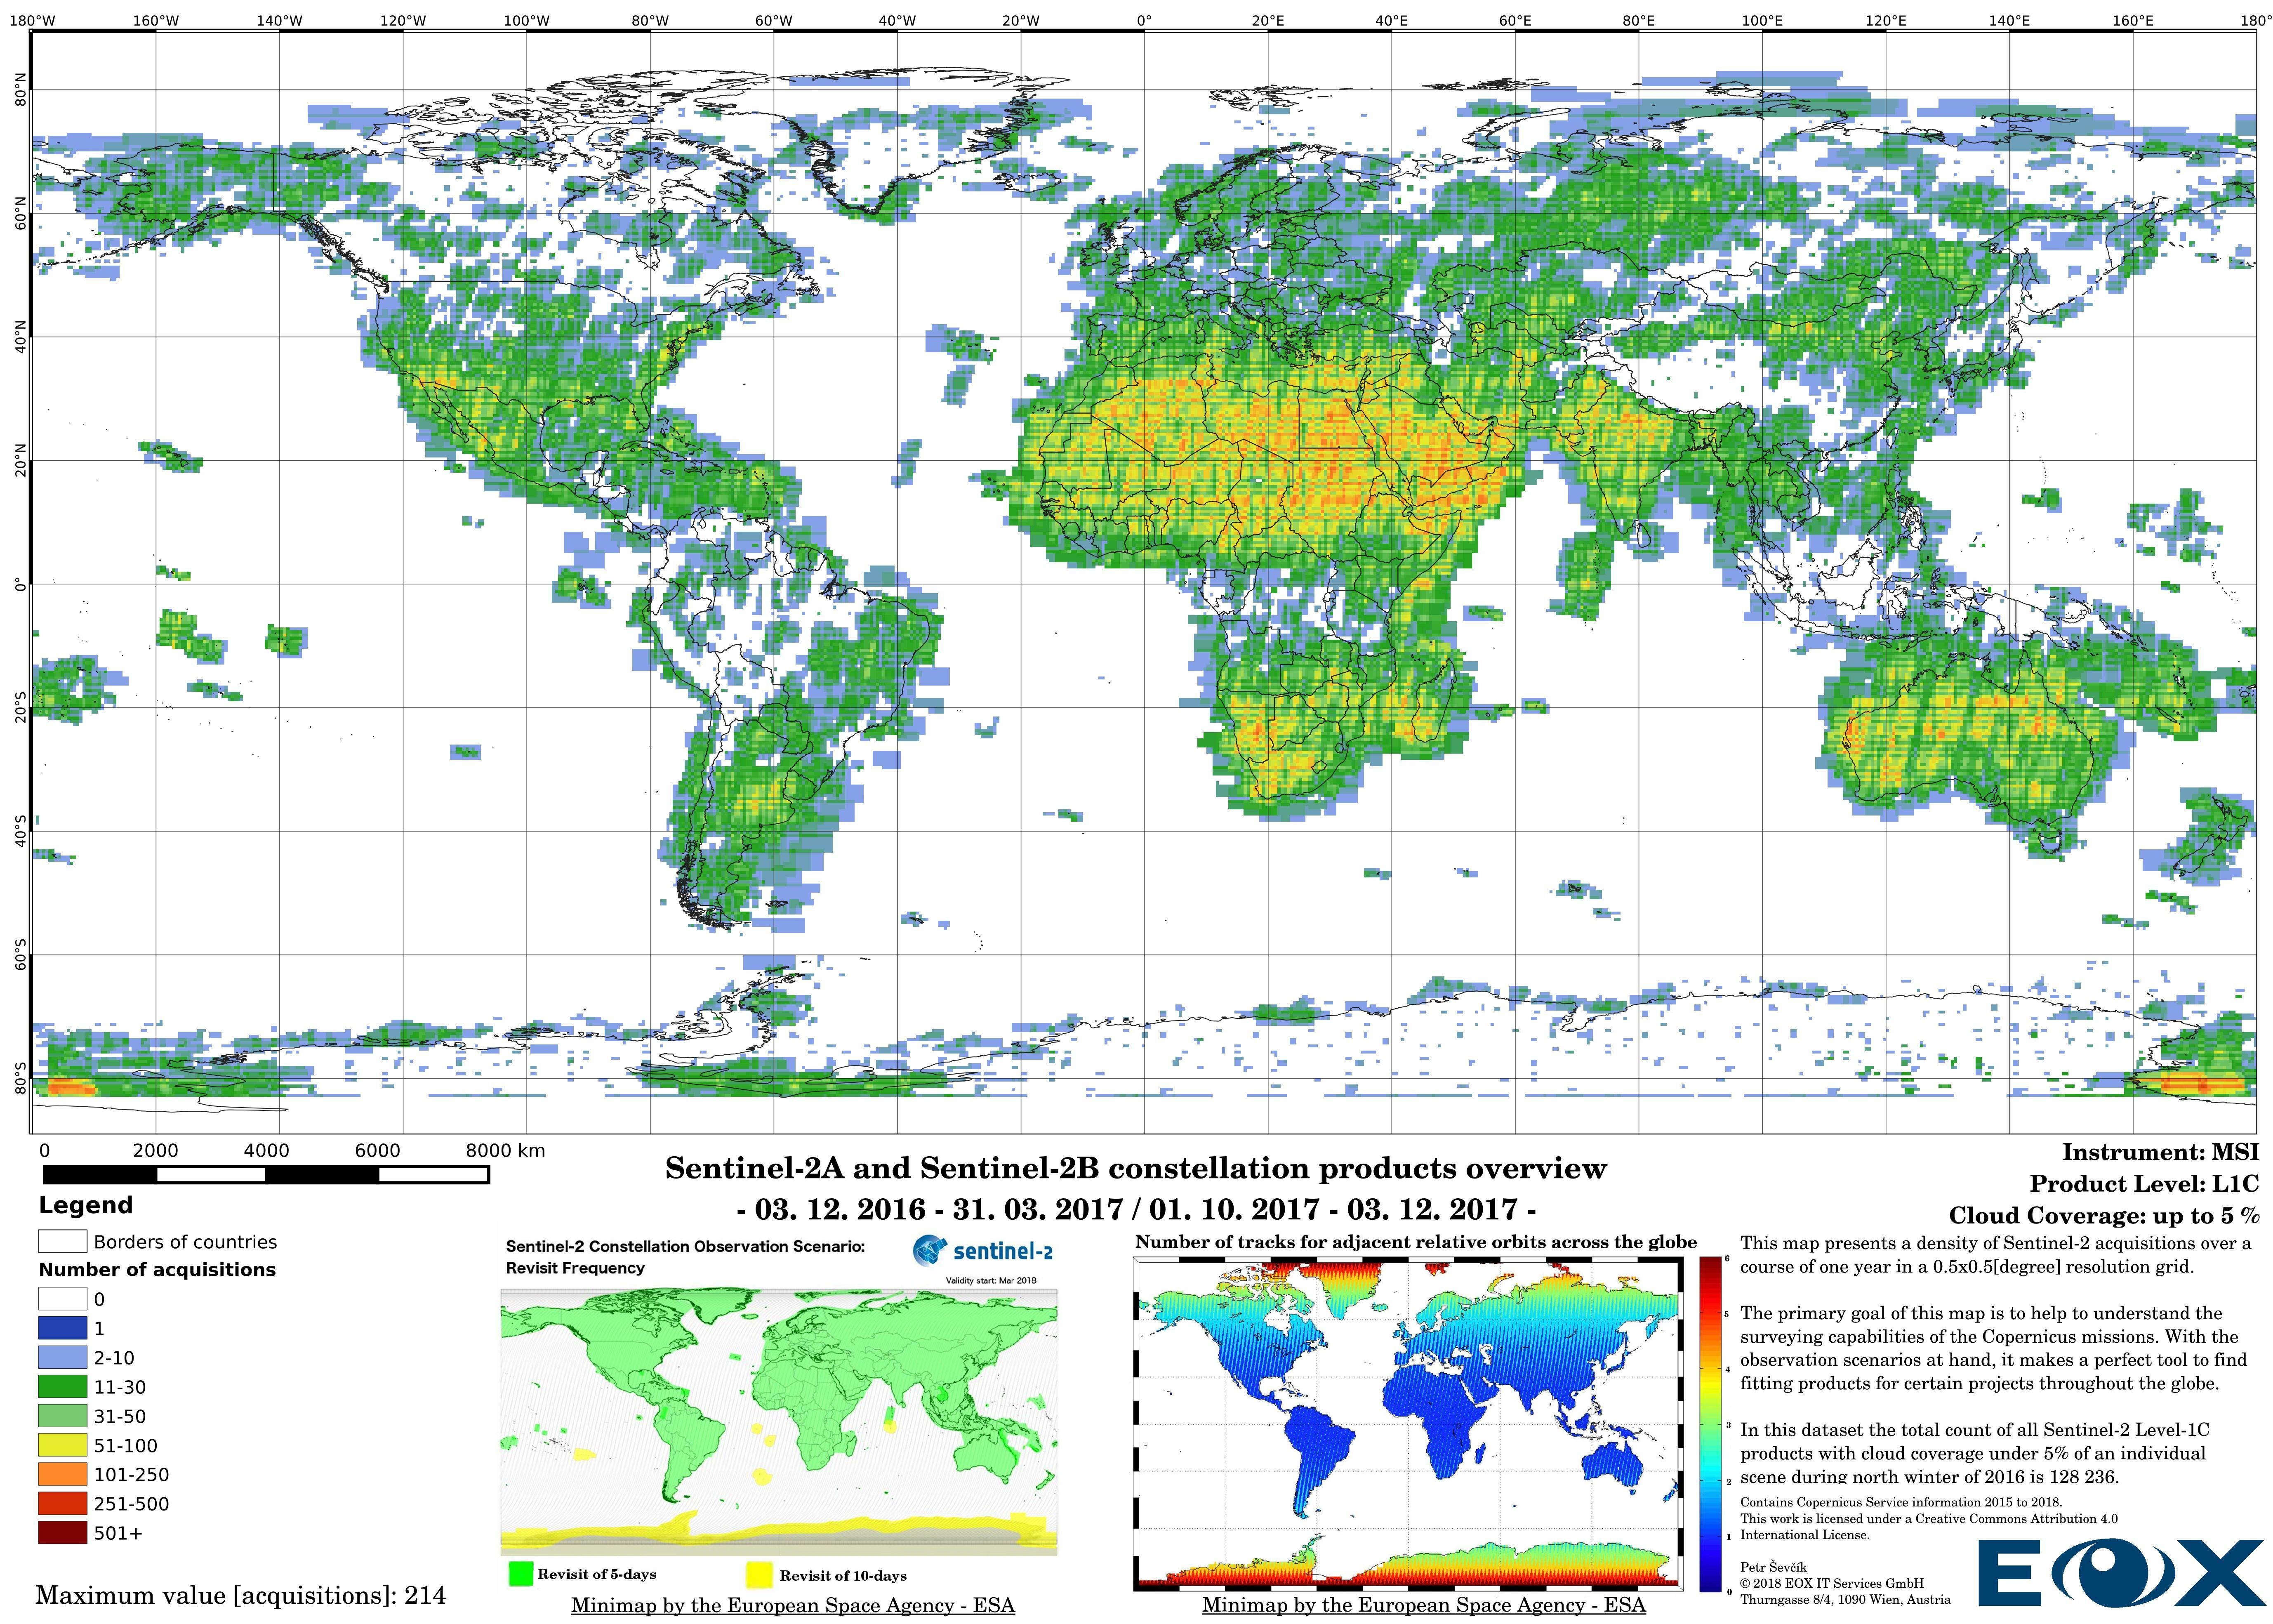
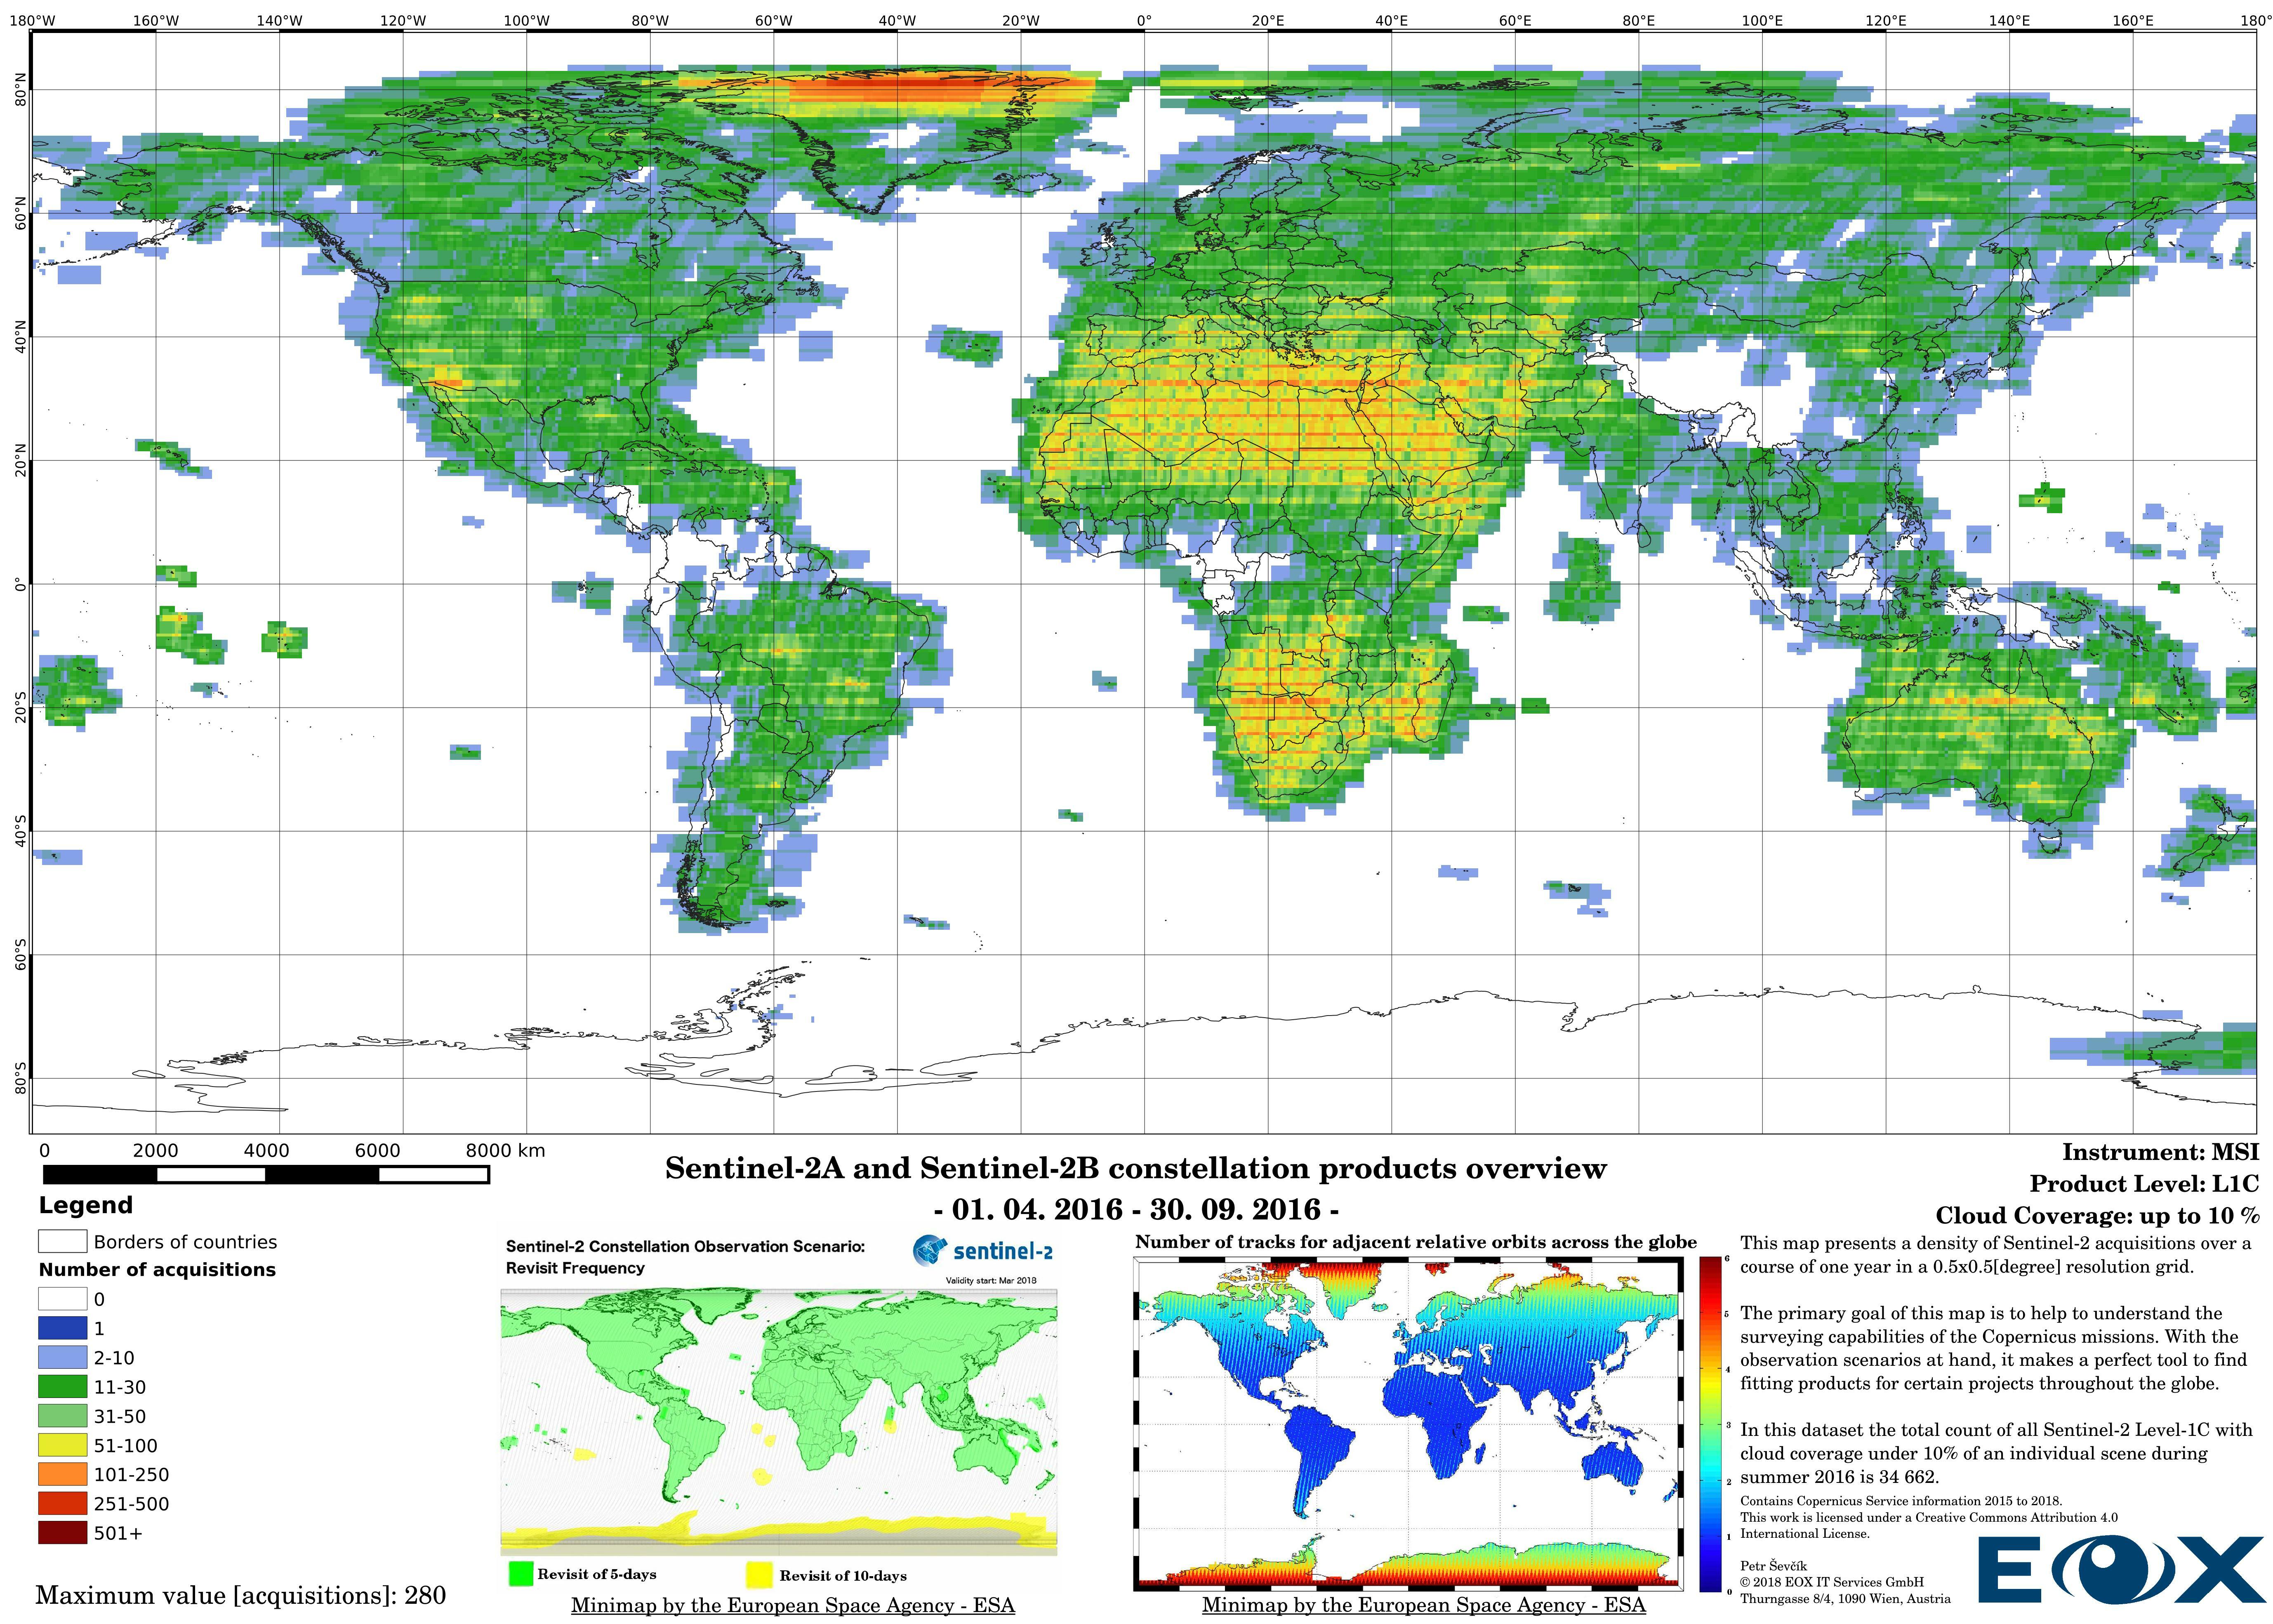
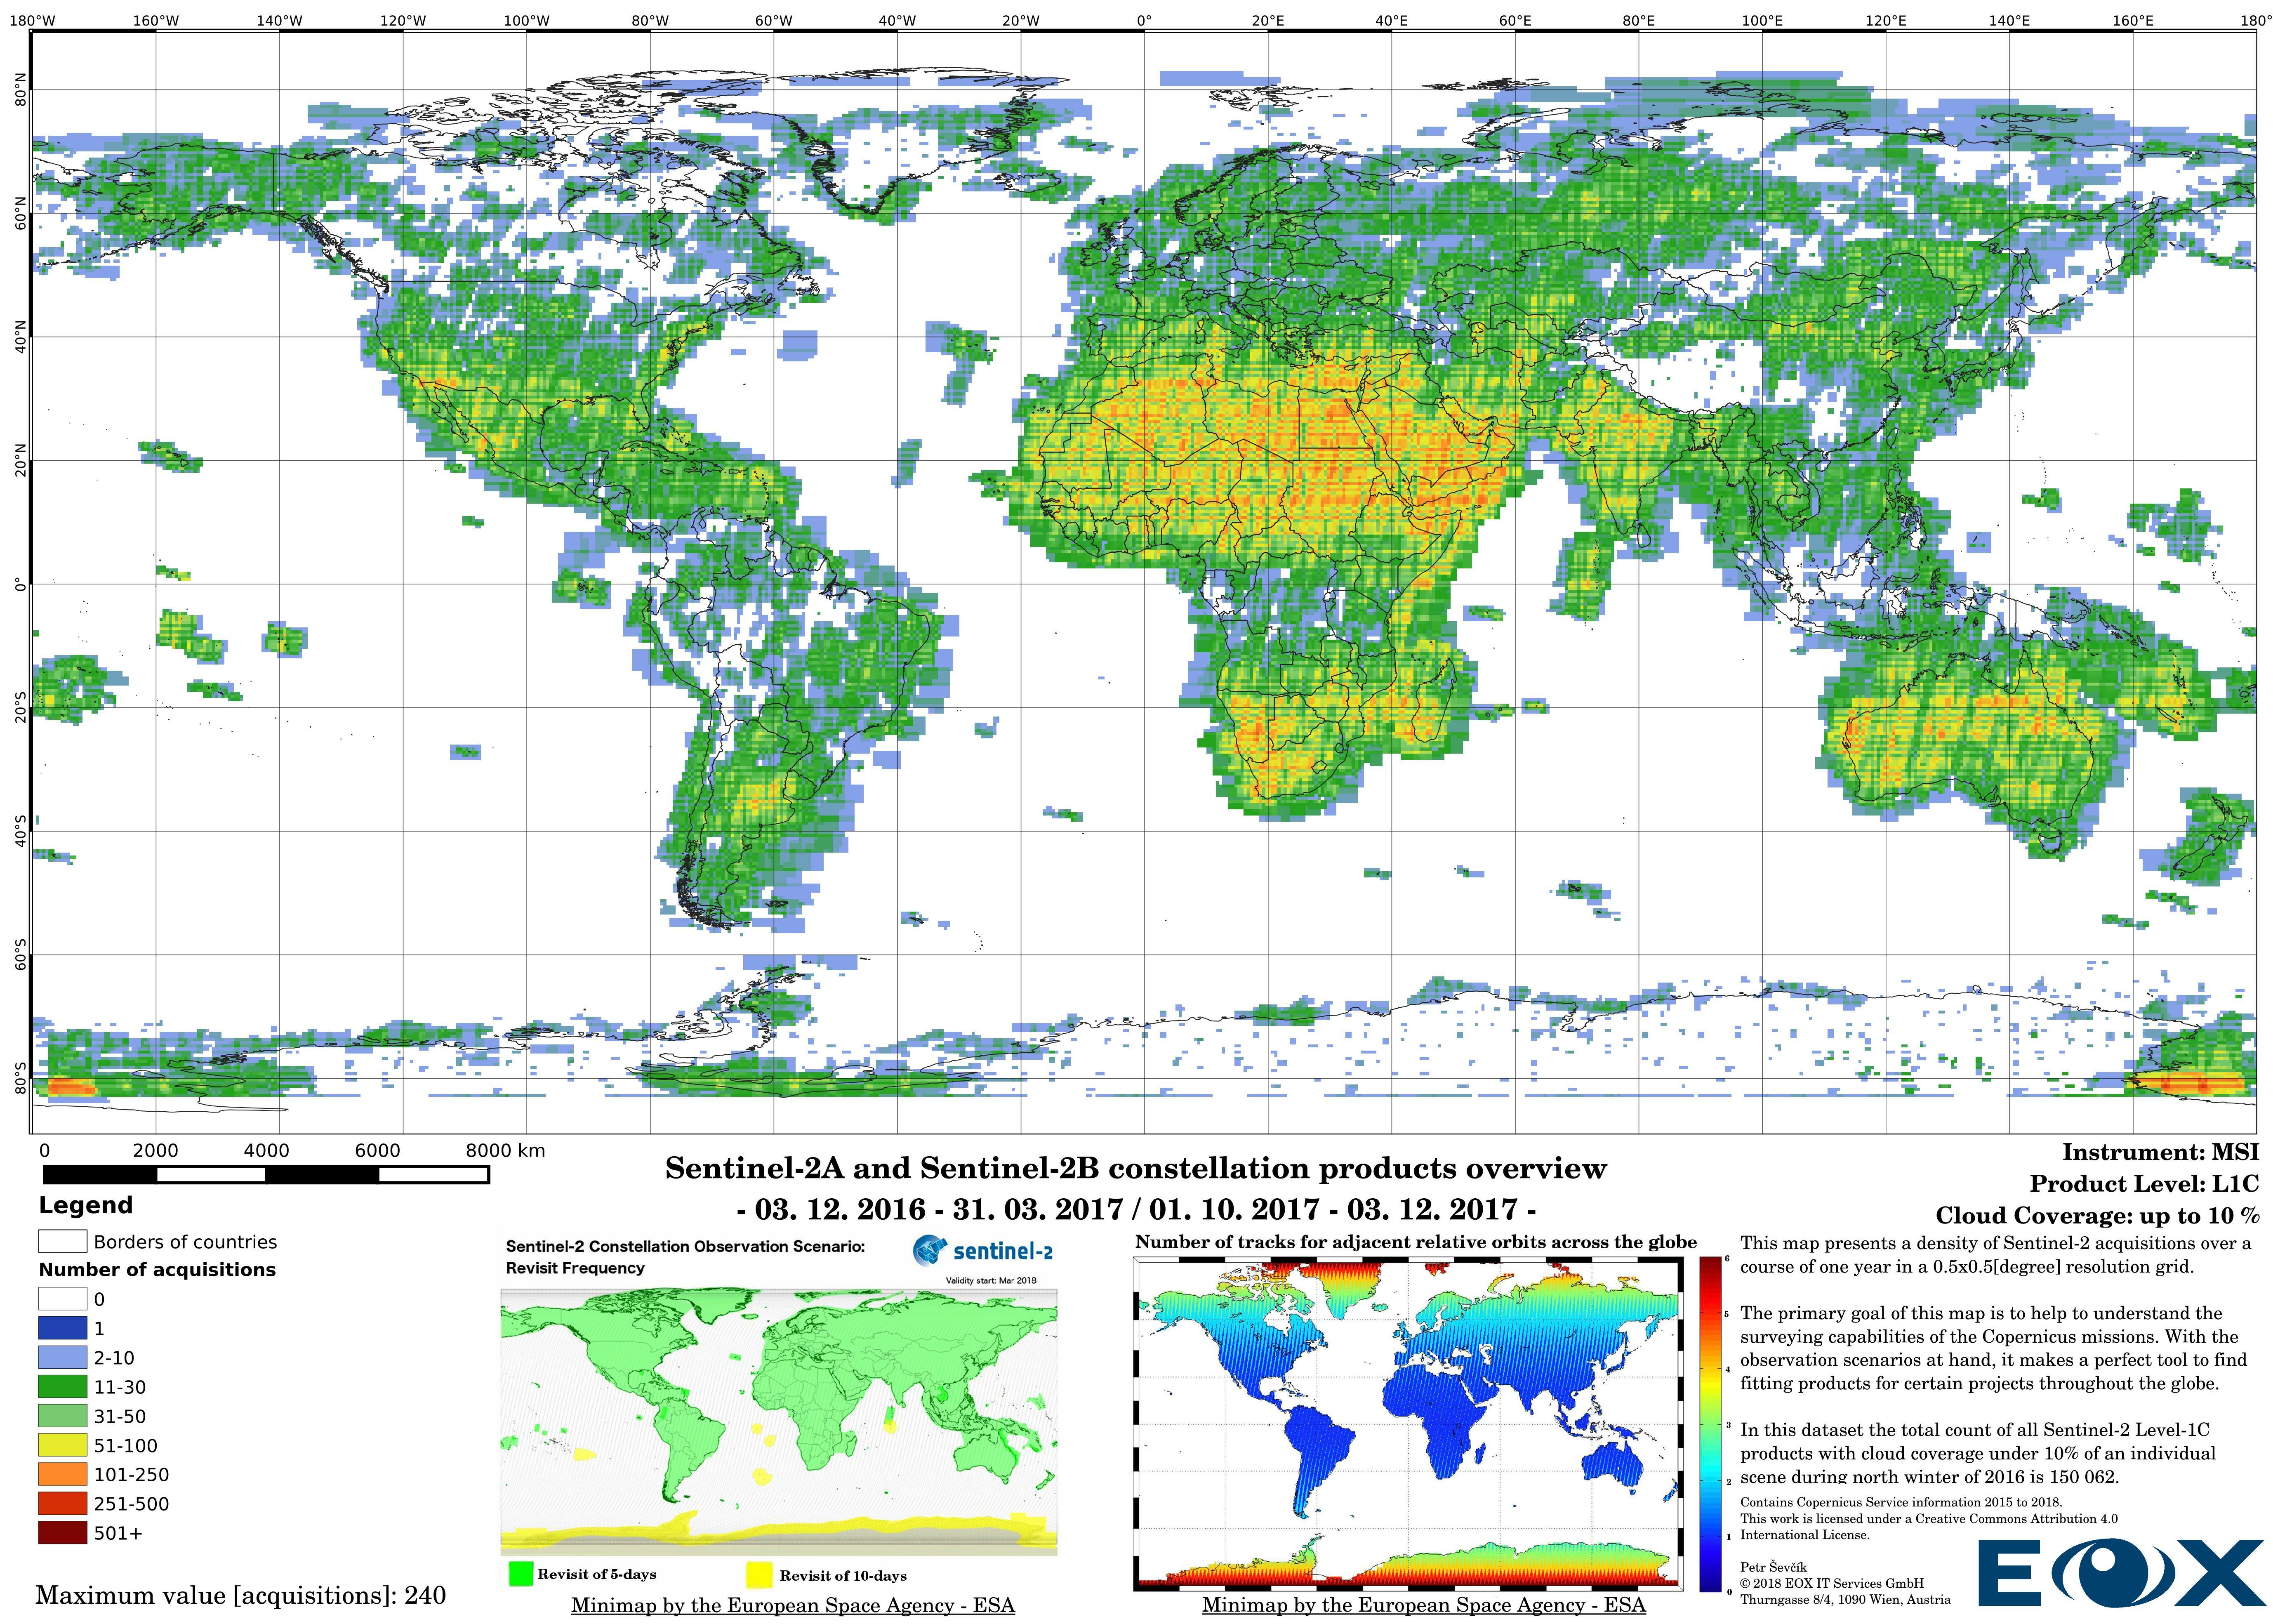
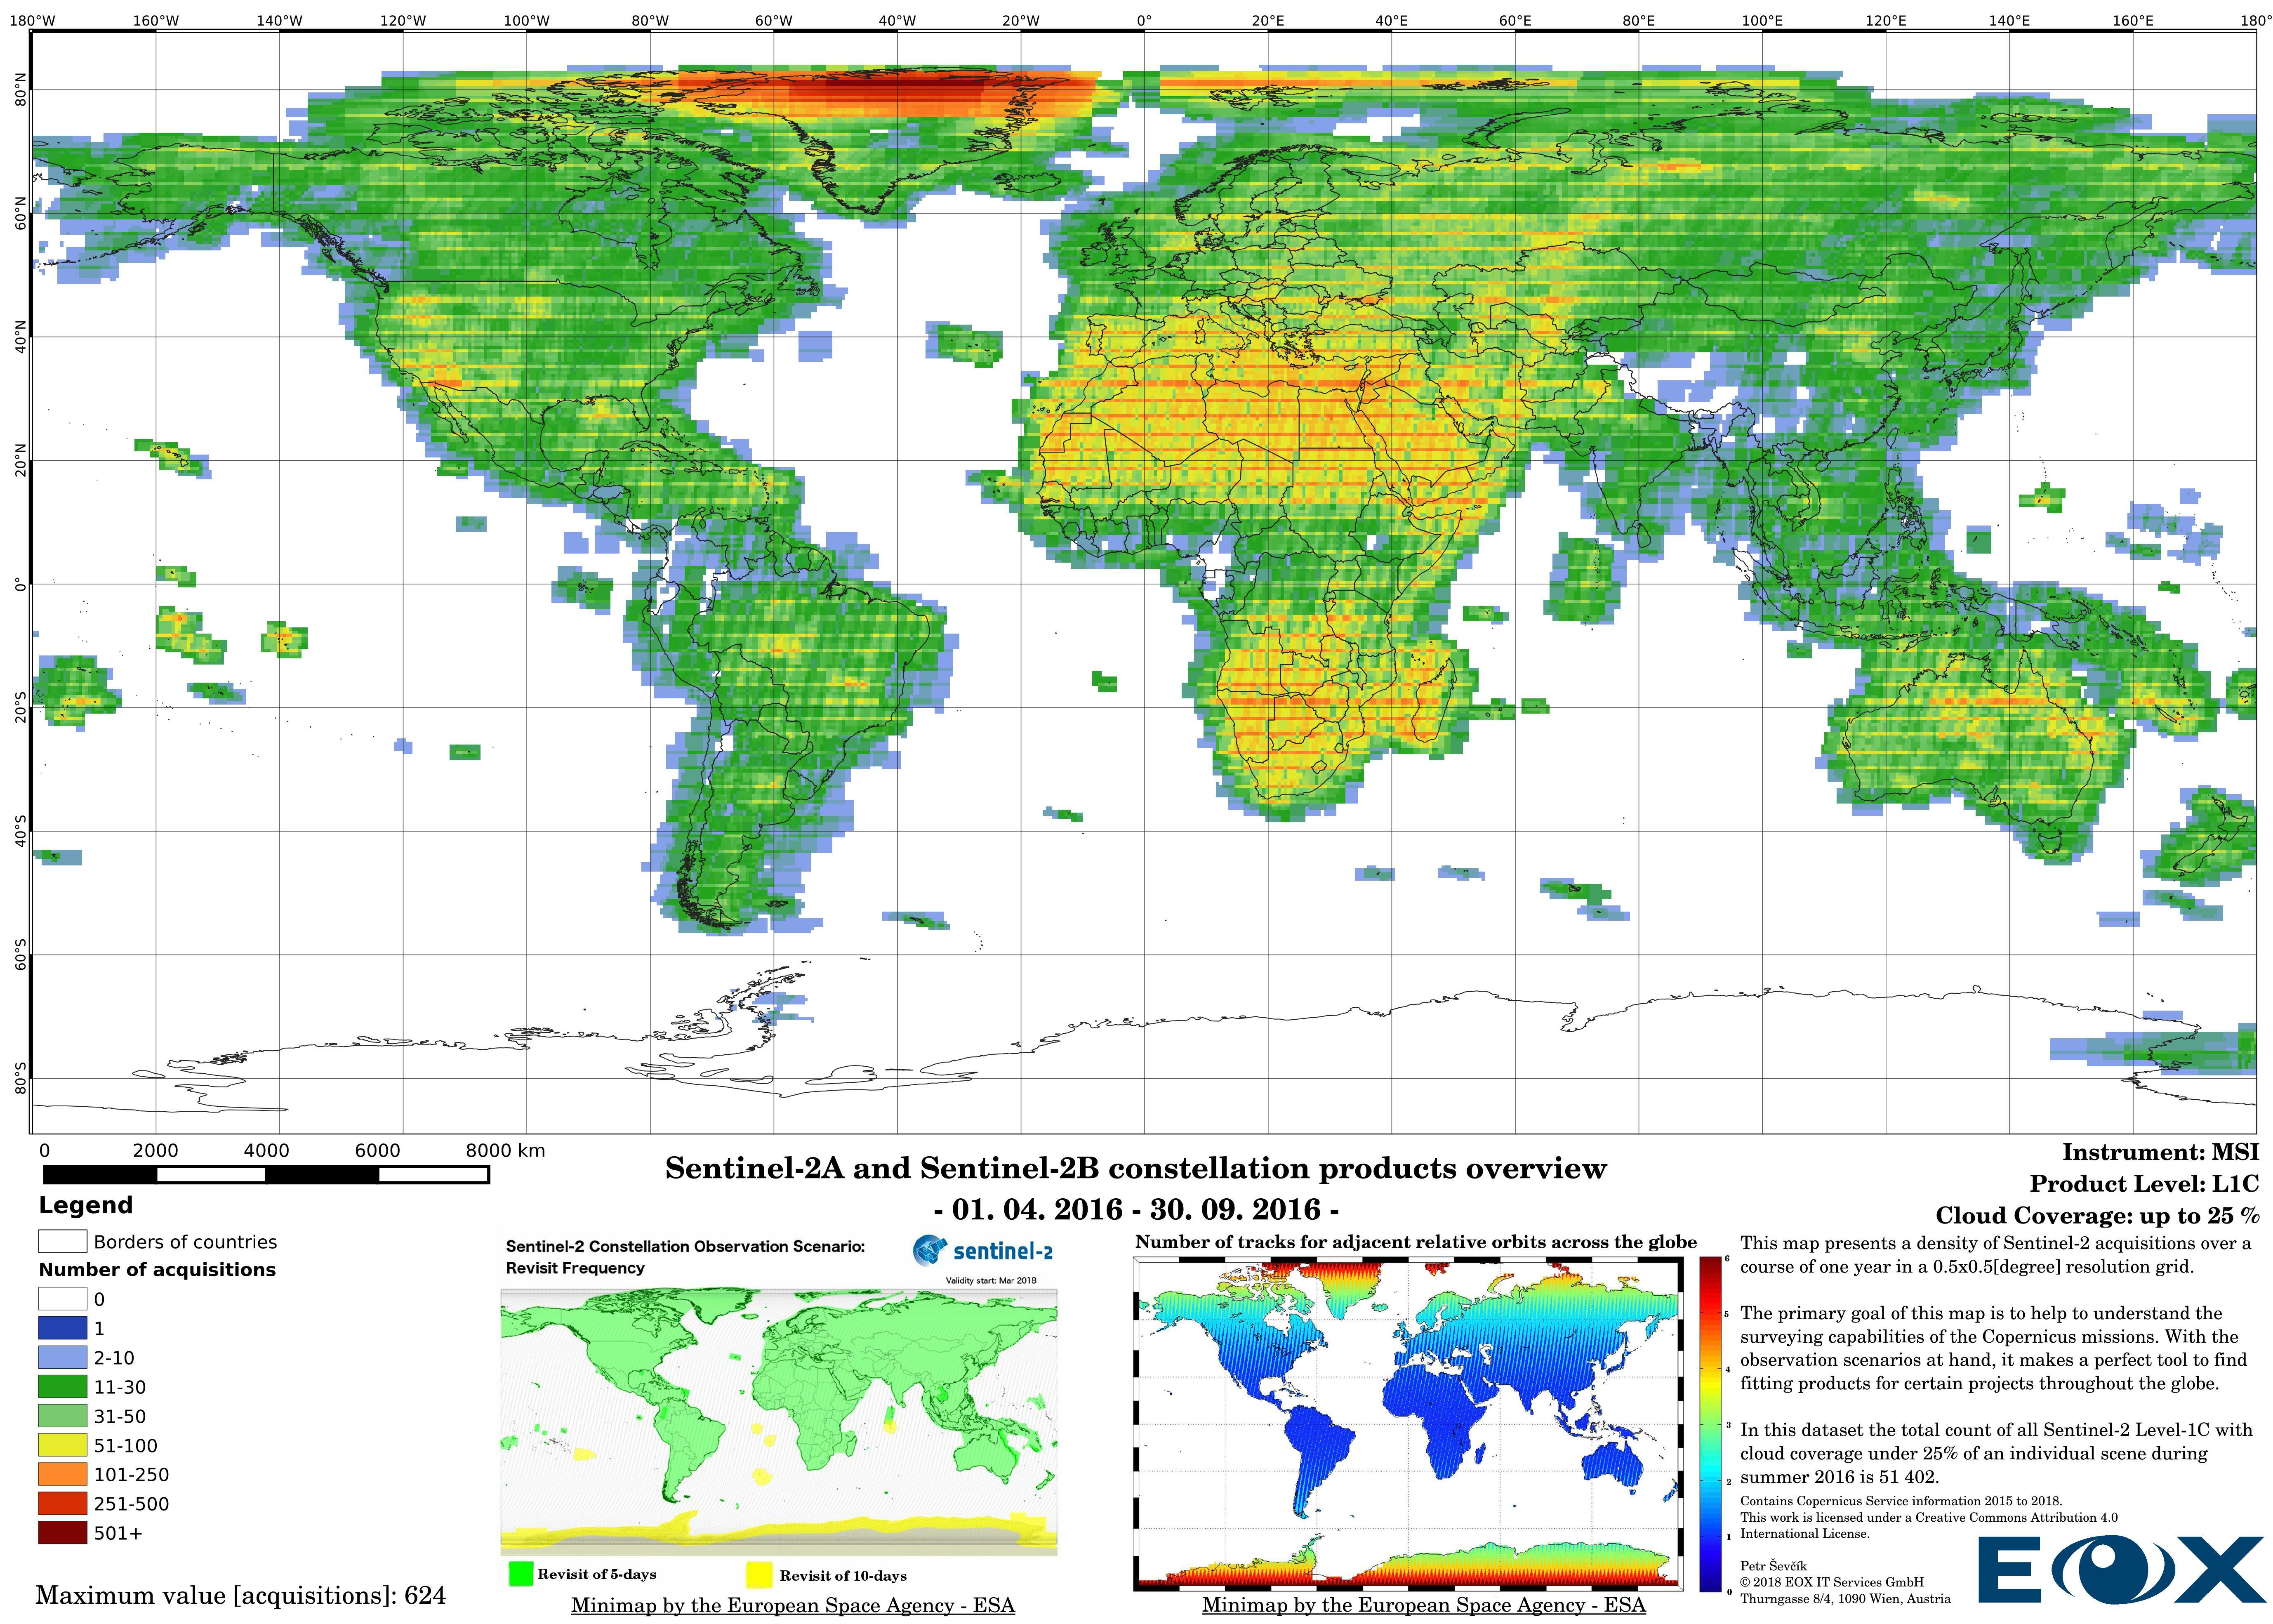
For instance, the idea could be to offer a cloudless mosaic of the entire Earth's landmass like our Sentinel-2 cloudless (opens new window), but the resources are limited and decisions should be based on knowledge to see if the project is at least feasible. Let's look at the example, the Sentinel-2 cloudless (opens new window) result is determined by a lot of factors, to simplify this example we will pretend that the processing was done instantly and therefore we are looking solely at the input and the output. The most crucial factors are the source data and its time window. If we look at the map below we can see some cloud artifacts mostly present around the equator, these are caused by the intense evaporation and rainfall in the tropical regions as well as the connection to the innertropical convergence zone (opens new window) (ITZ). Other cloudy scenes are located vastly in East Asia, Tibet Plateau, parts or Siberia, and certain swaths in North America. To a certain degree weather at the moment of the individual acquisitions is the reason for these cloudy scenes outside of the ITZ. Nonetheless, if we take a closer look at the minimaps, we can distinguish the lesser acquisition density for products with less cloud coverage, if we take the other maps in this article into consideration we can say that, even if there are enough cloud-free pixels in other scenes, there is a higher chance that the scenes can be more severely affected by water vapor or light cirrus clouds (opens new window), which might have been considered as cloud-free in the processing. This practice is not a set law, but we can use this reference as a rule of thumb.
# Summary of the Sentinel-2 development until early 2018
A lot has changed since the launch of the Copernicus (opens new window) satellite Sentinel-2A on the 23th of June 2015. Like with most of Copernicus (opens new window) satellite missions, Sentinel-2 is a satellite constellation which consist of a pair of operational satellites. The twin Sentinel-2B joined its sibling on the 7th of March 2017 enhancing the Earth observation capabilities of the mission. The mission is operational since the 3rd of December 2015 and fully operational since 6th of June 2017. Currently the mission is finishing its ramp up phase (opens new window) to meet the mission requirements.
The increase of datavolume can be clearly seen between the years 2016 and 2017. Yet this is not the reason behind increasing the product numbers so drastically, the naming and the distribution structure of the Sentinel-2 products has been changed (opens new window) since the 6th of December 2016. This leads to publishing single 100x100km "granules" instead of "granule packages". This has lead to a tremendous increase of product entries of the Sentinel-2 data.
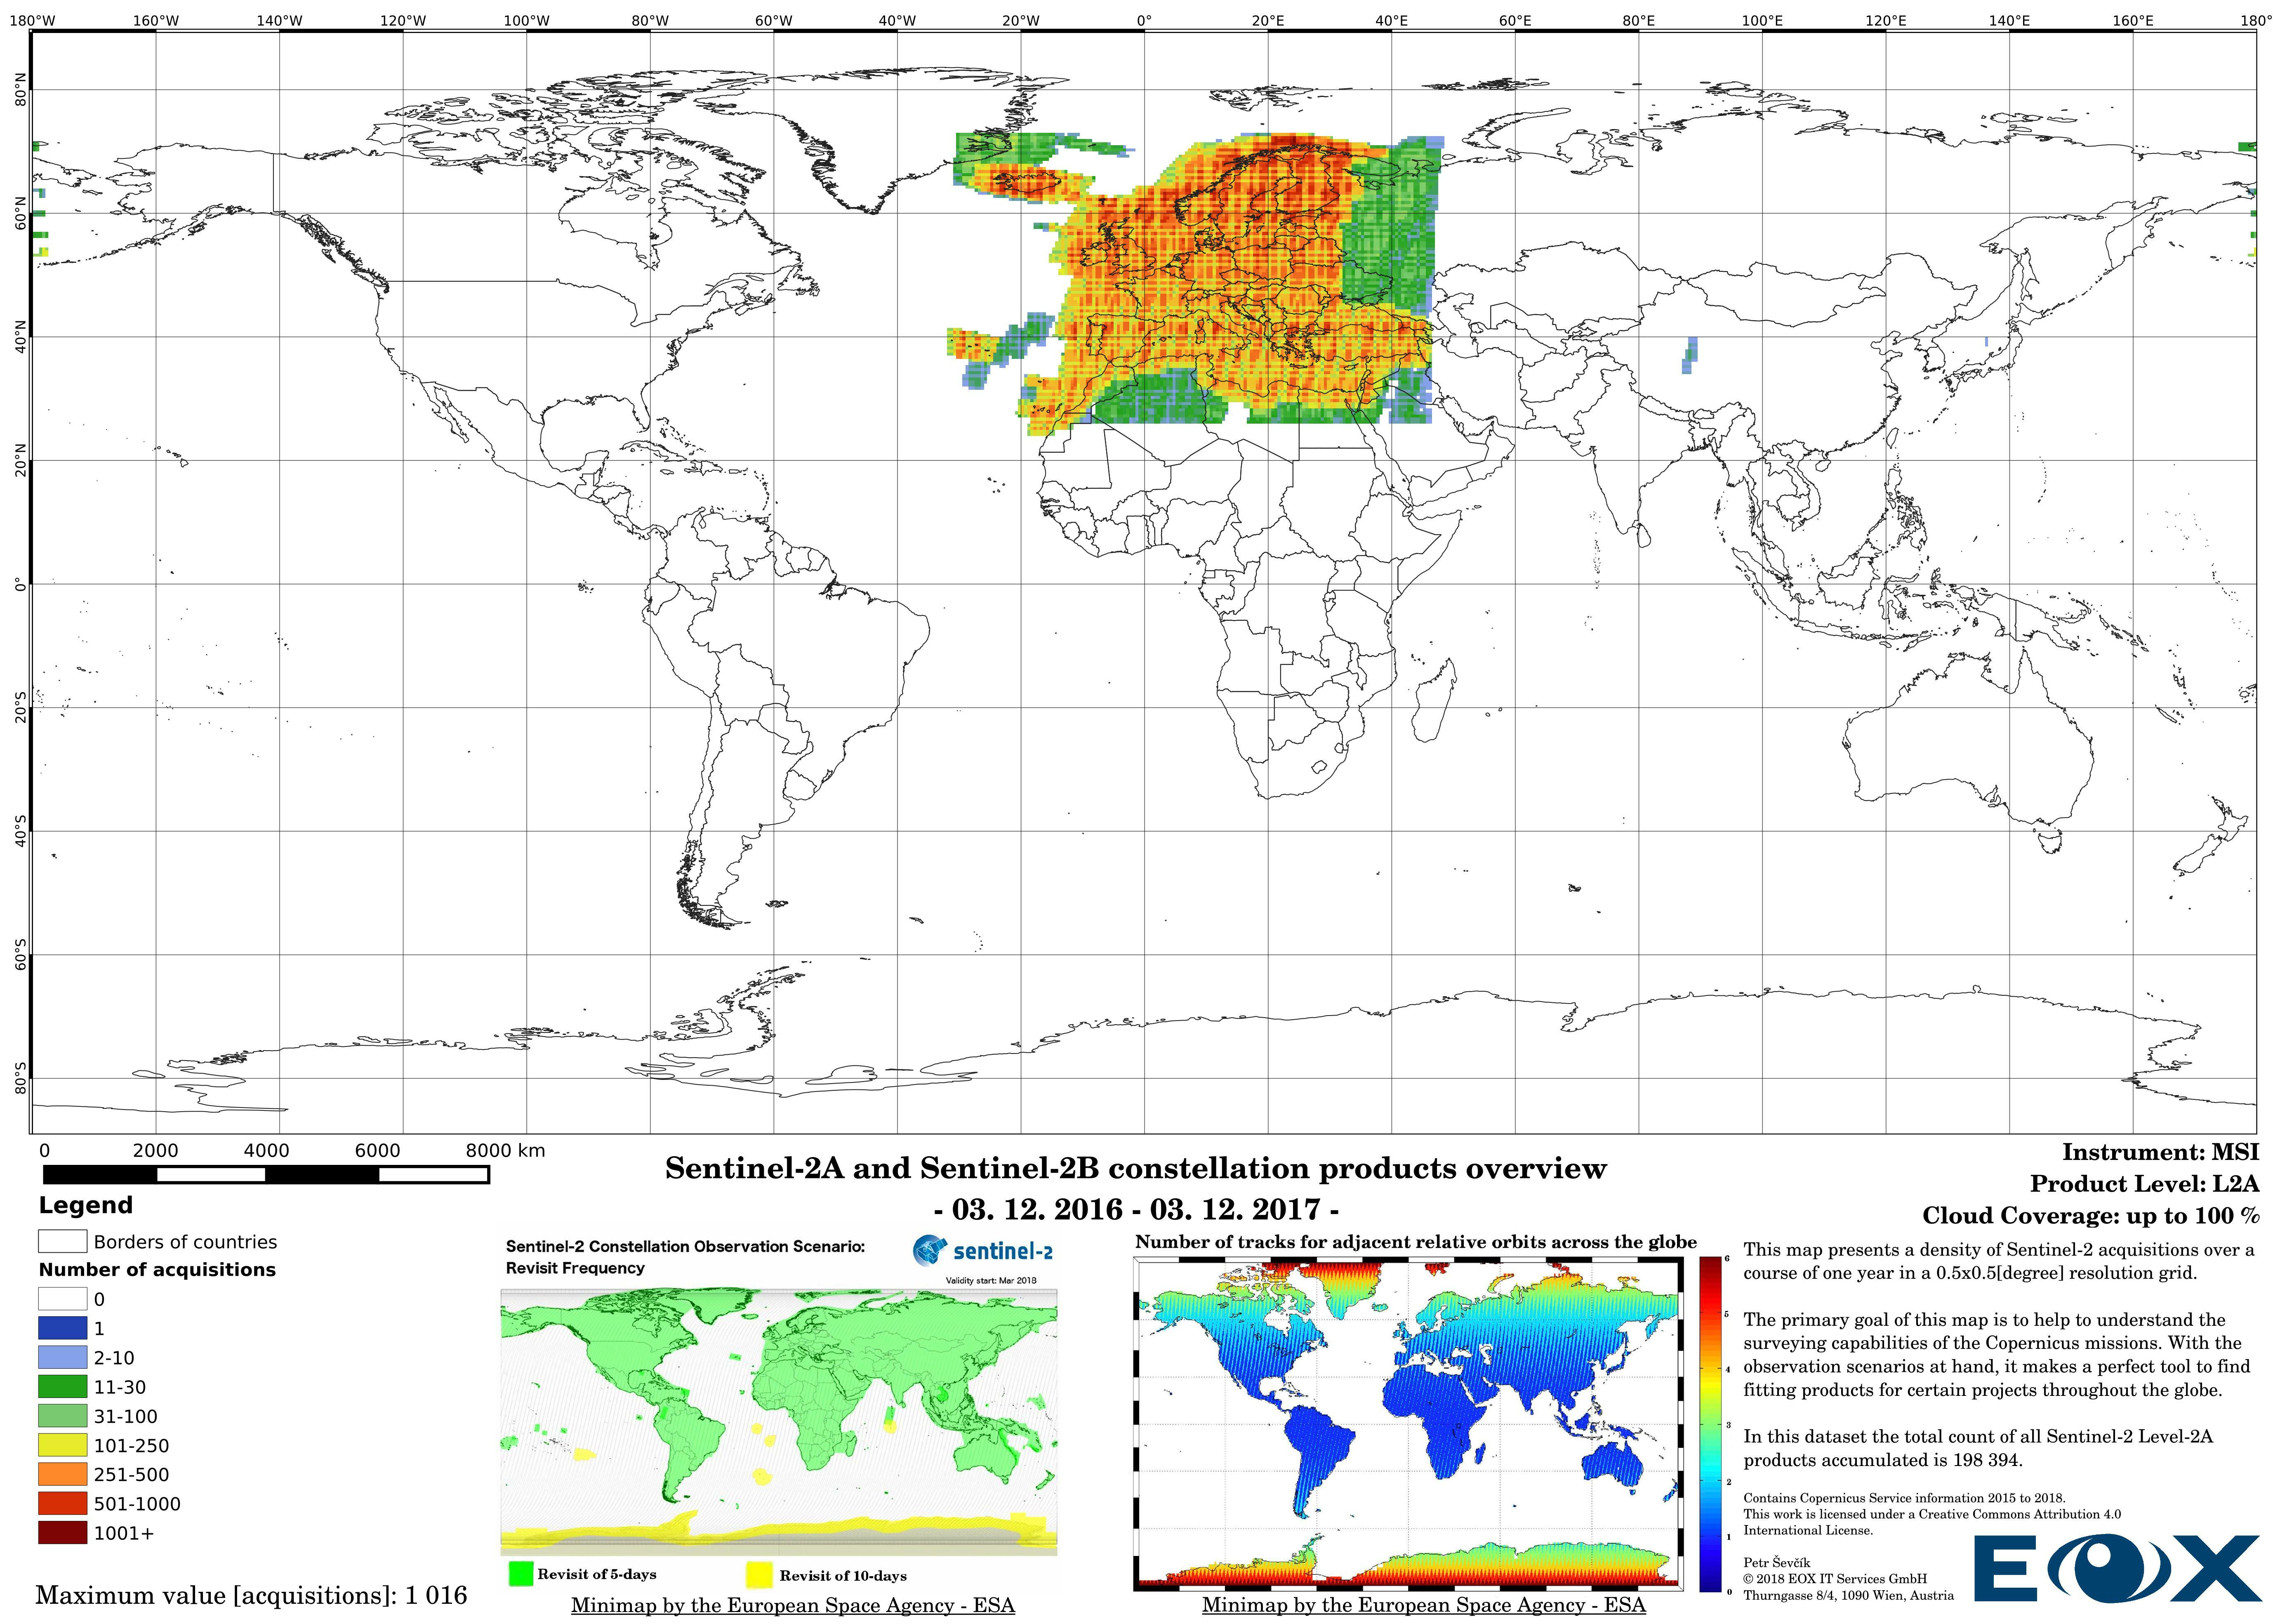
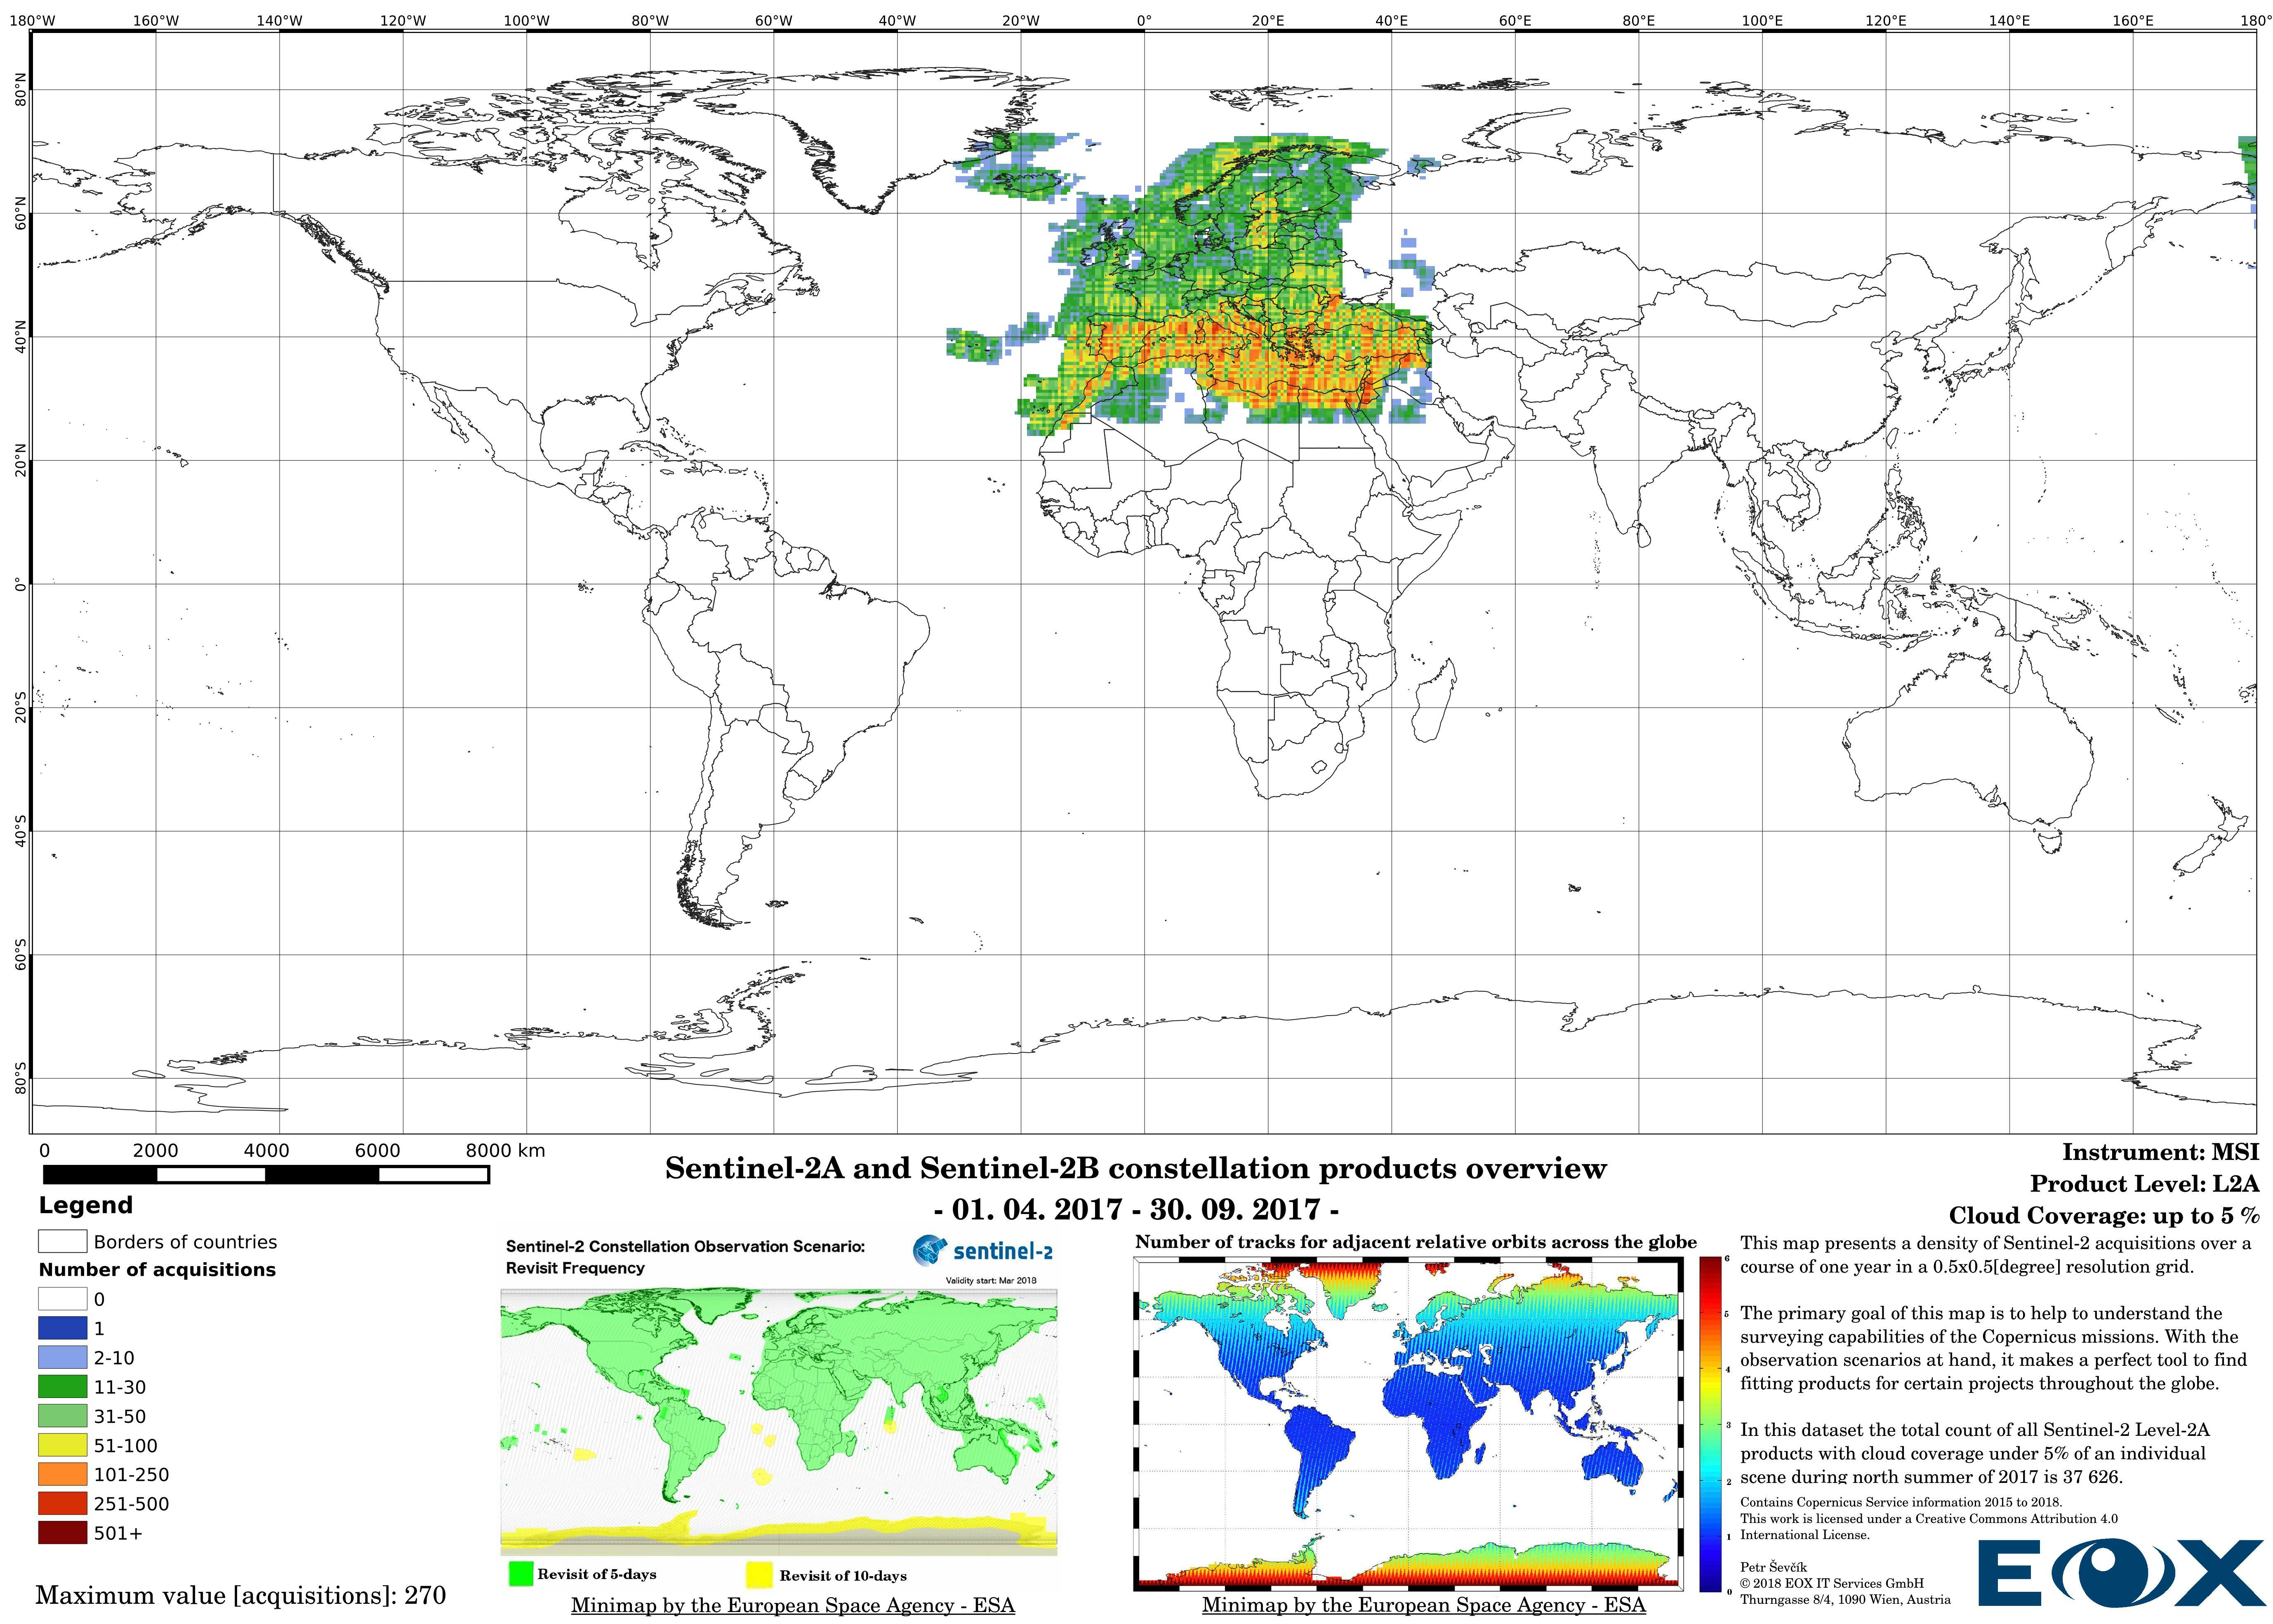
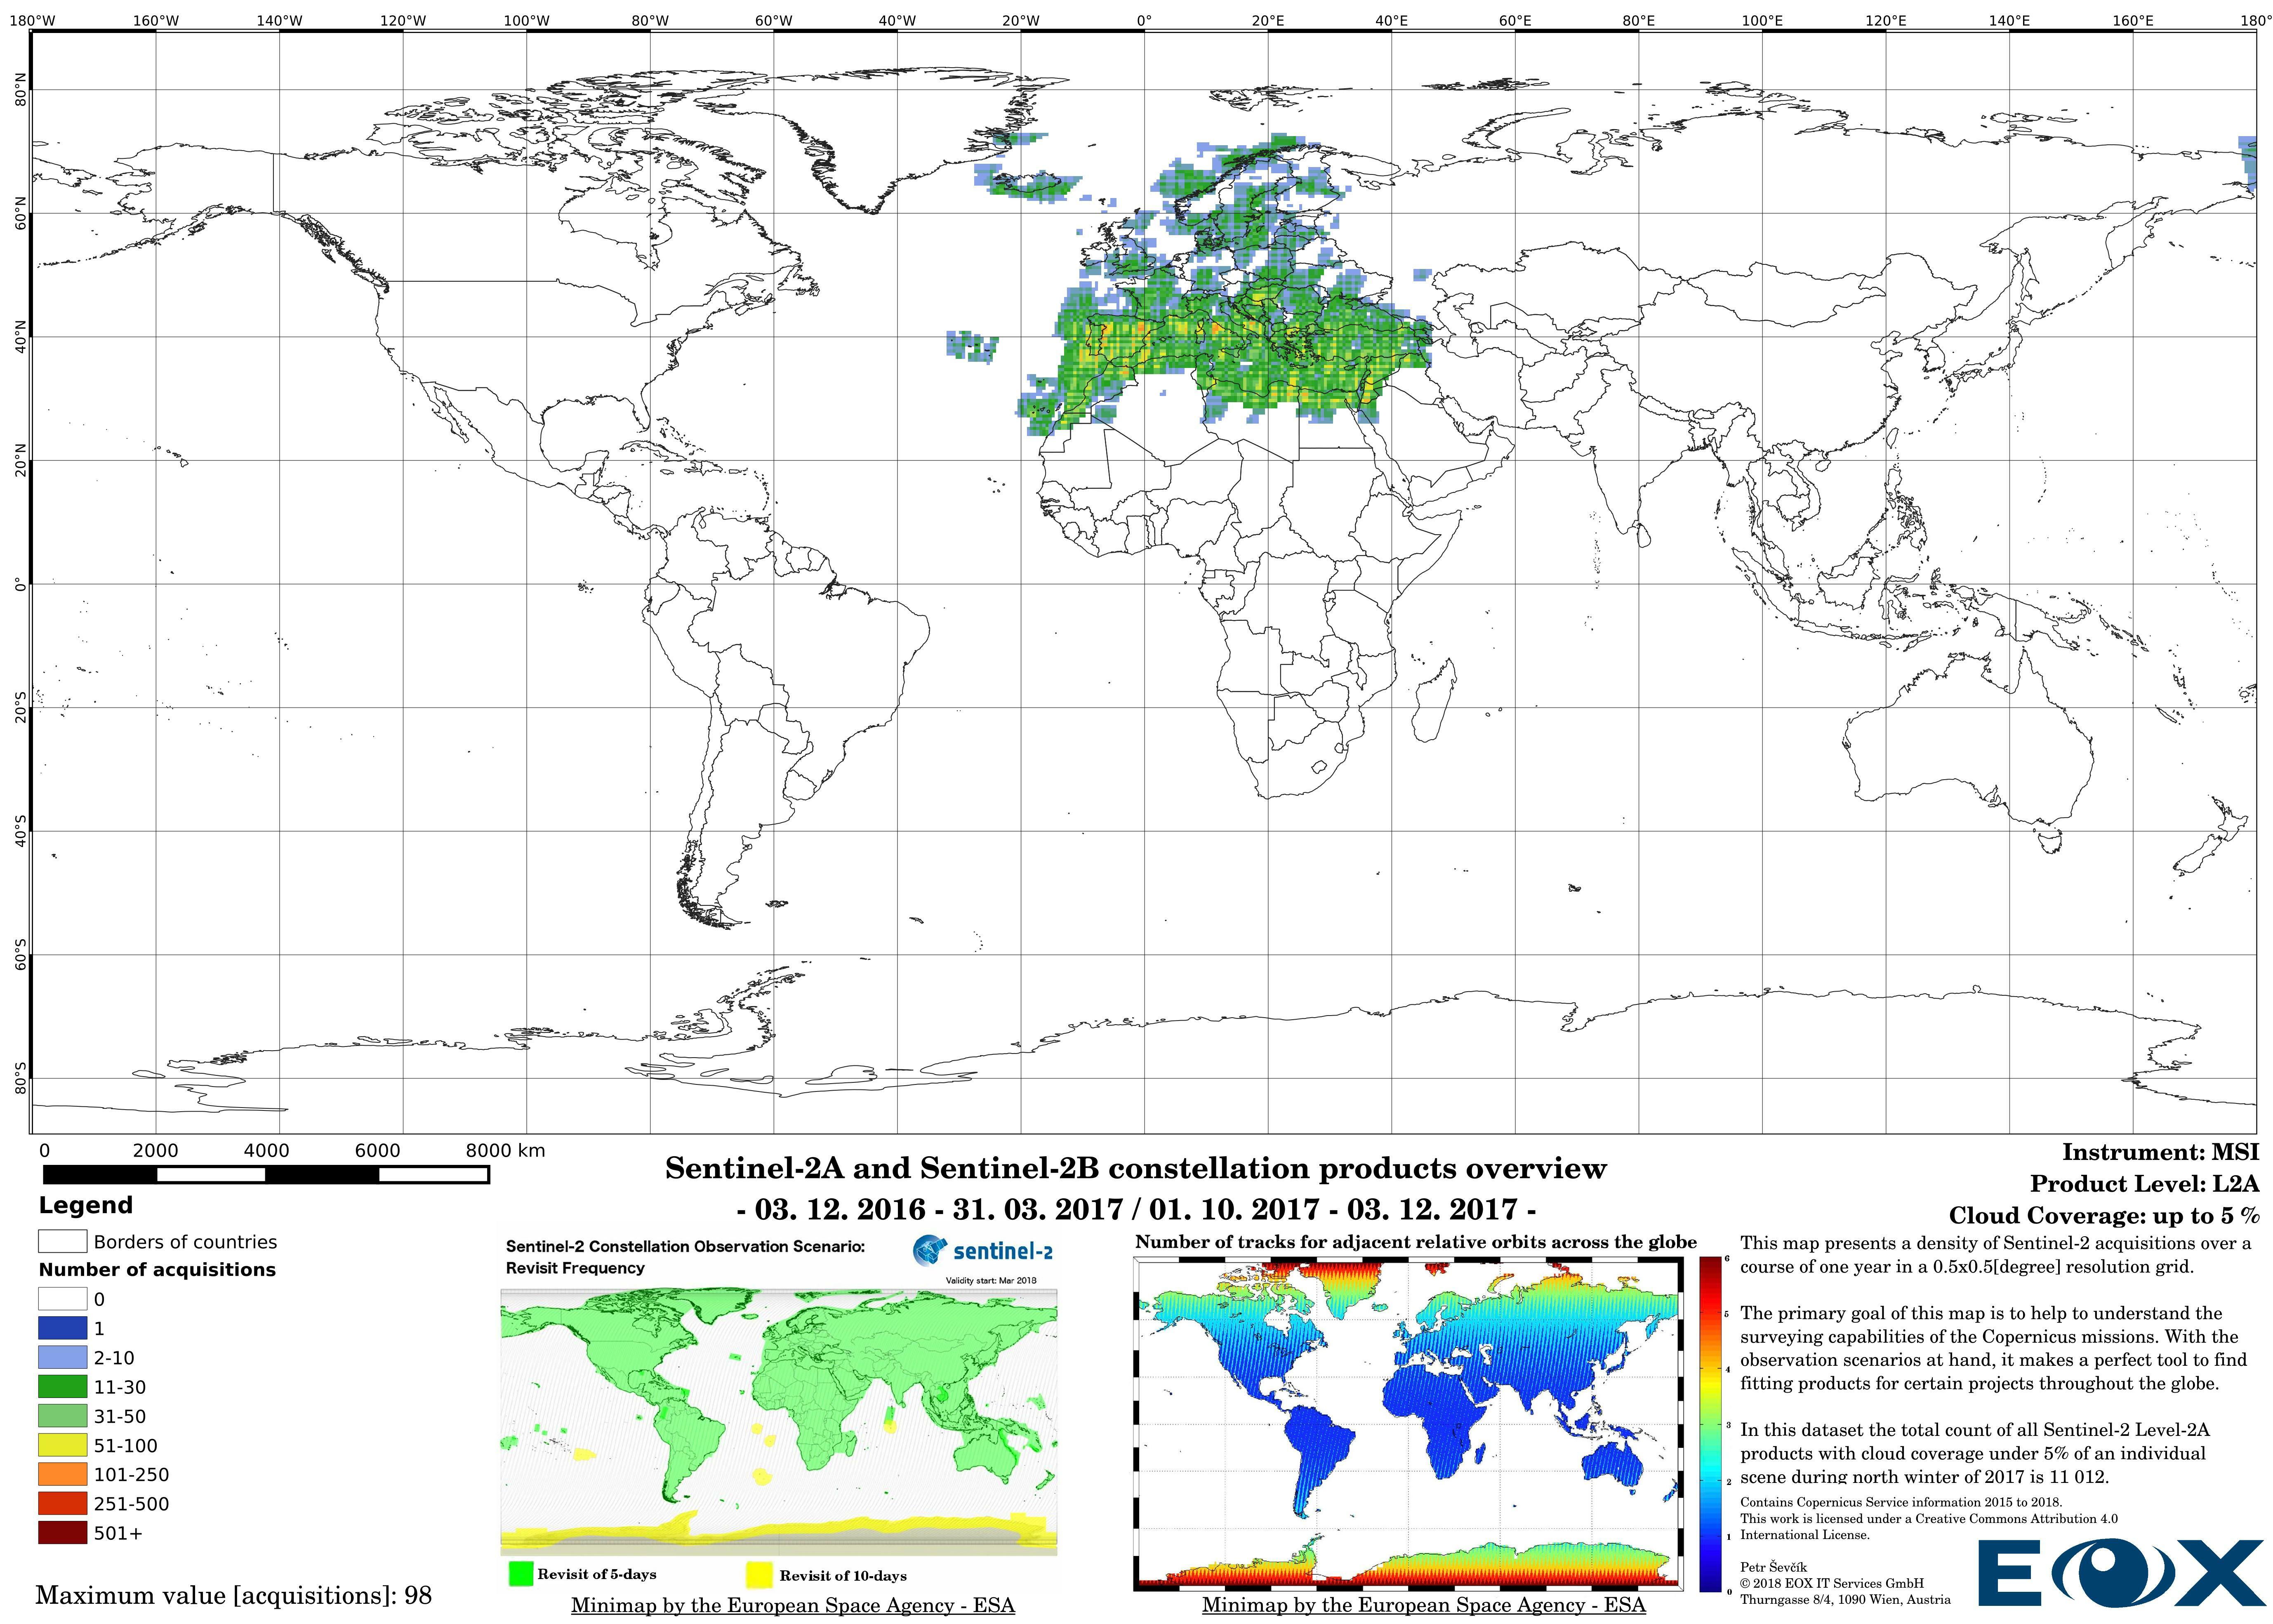
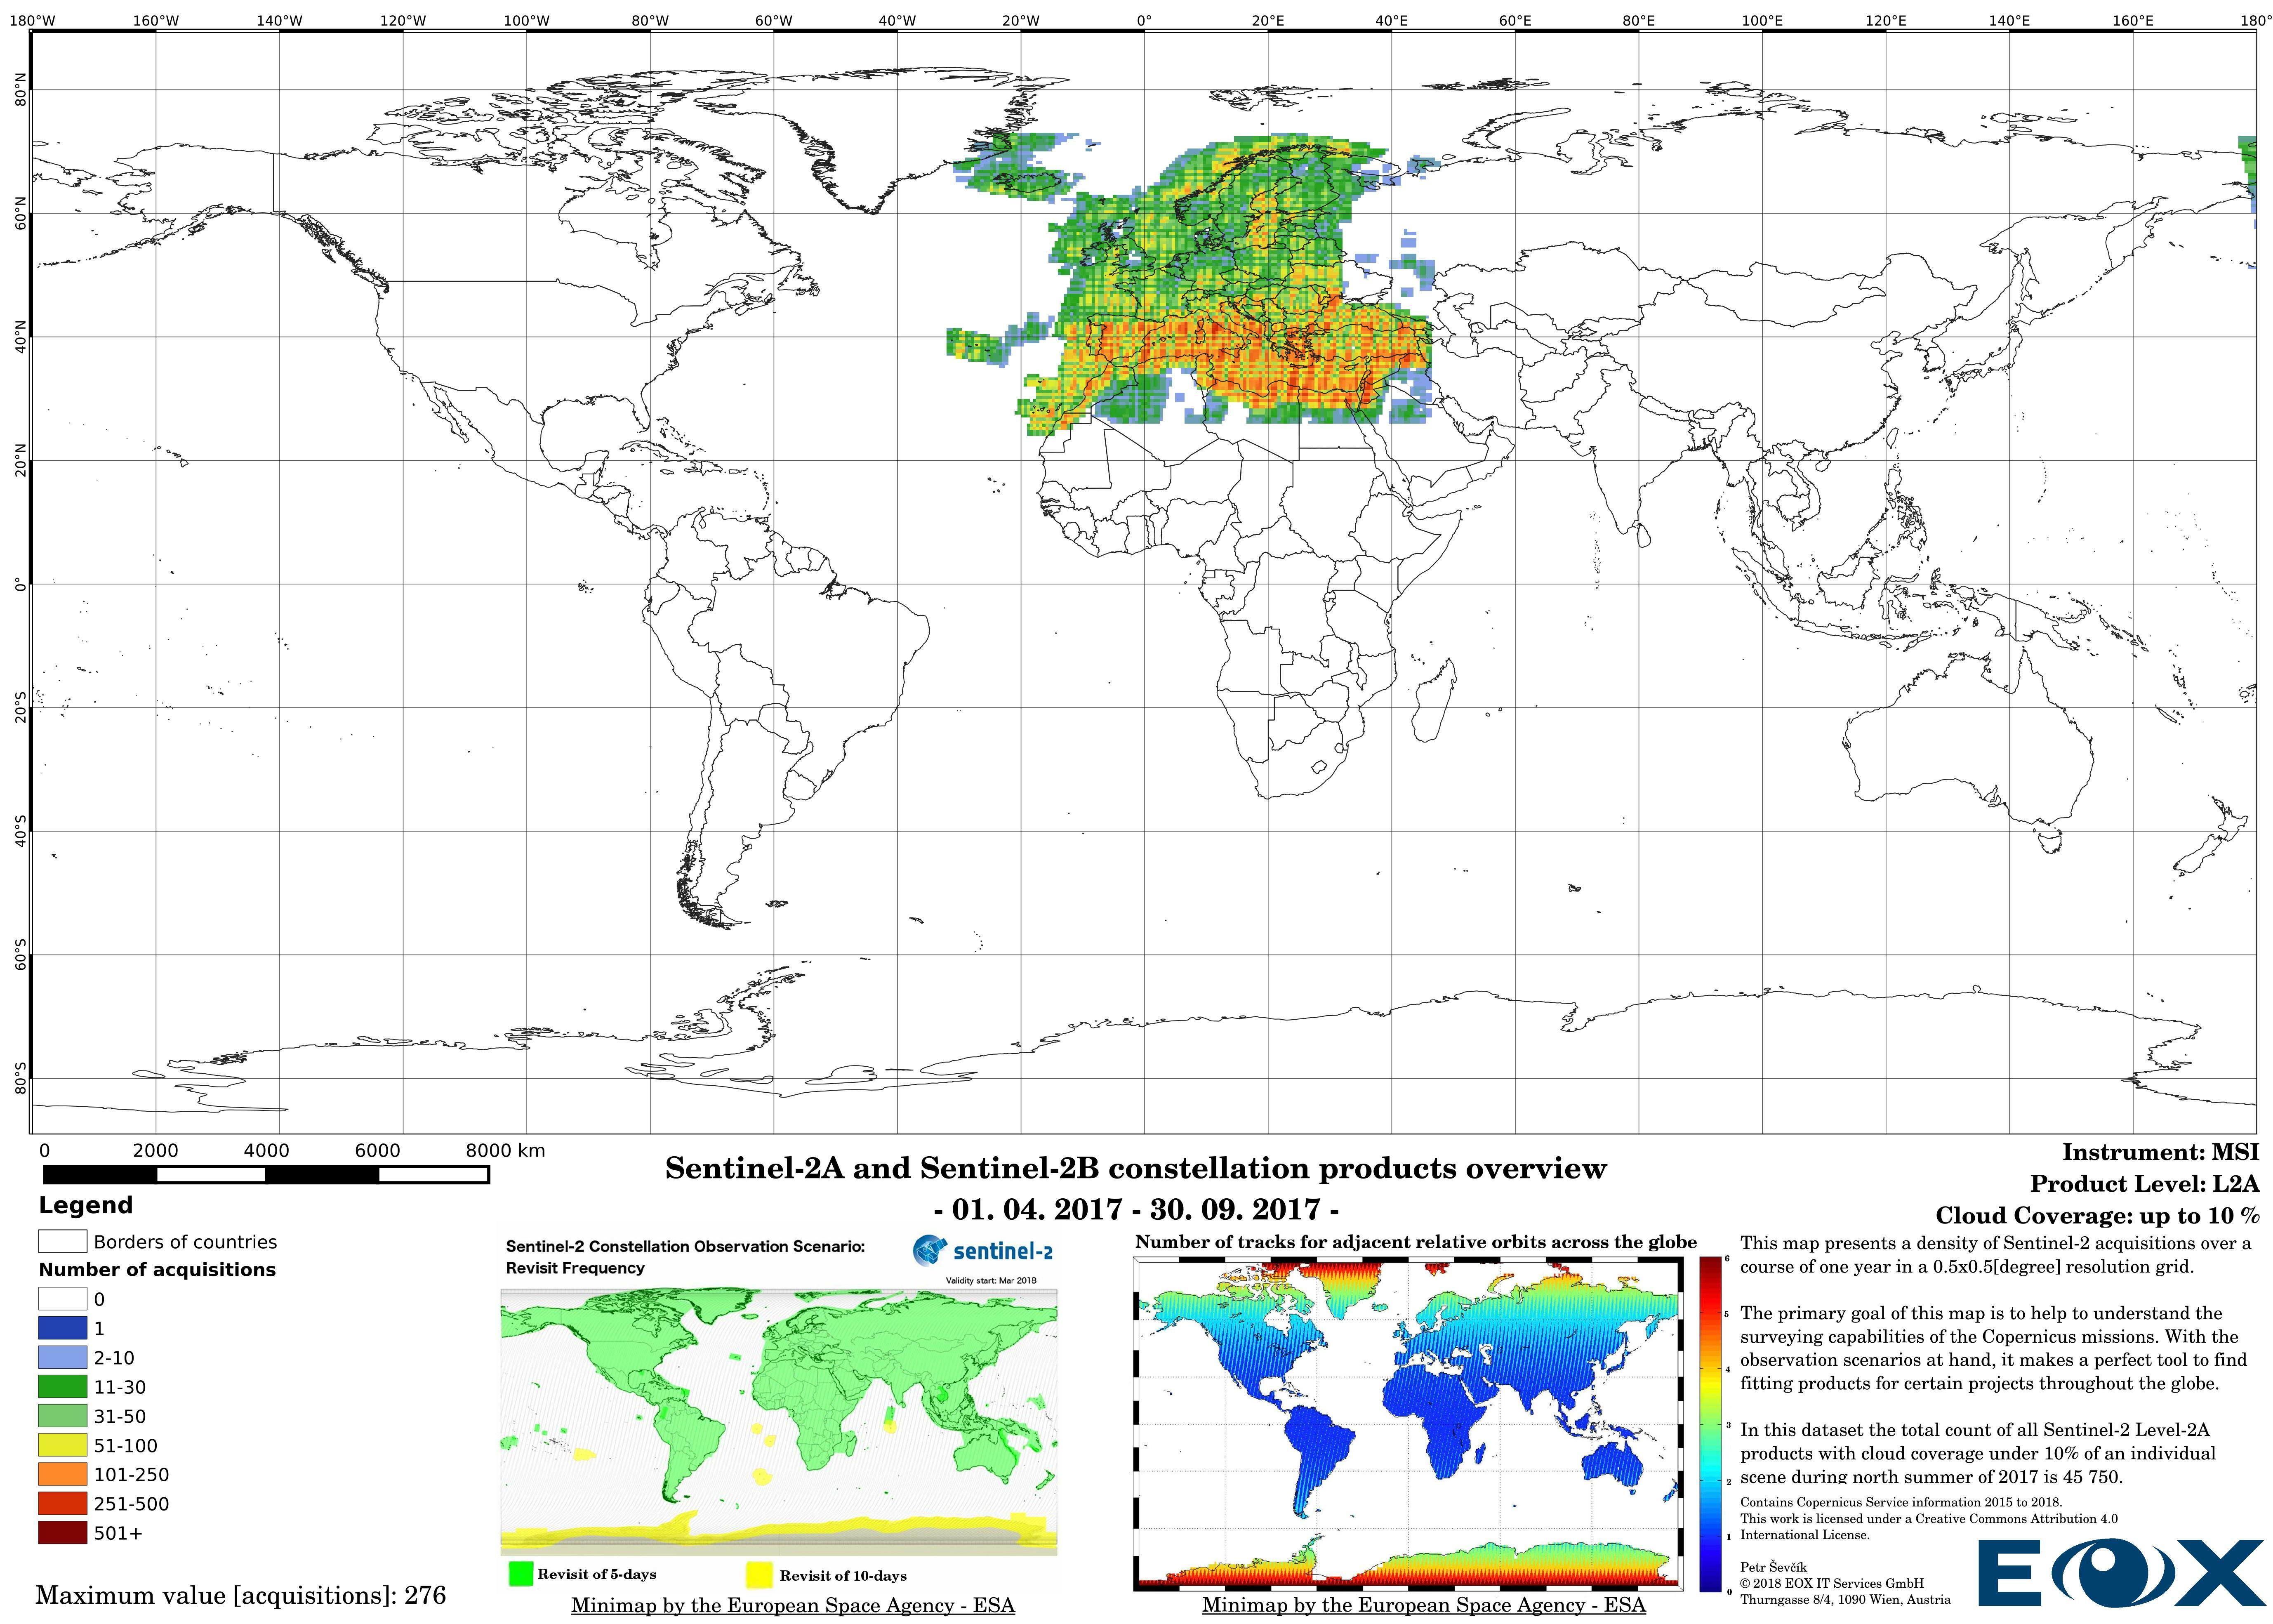
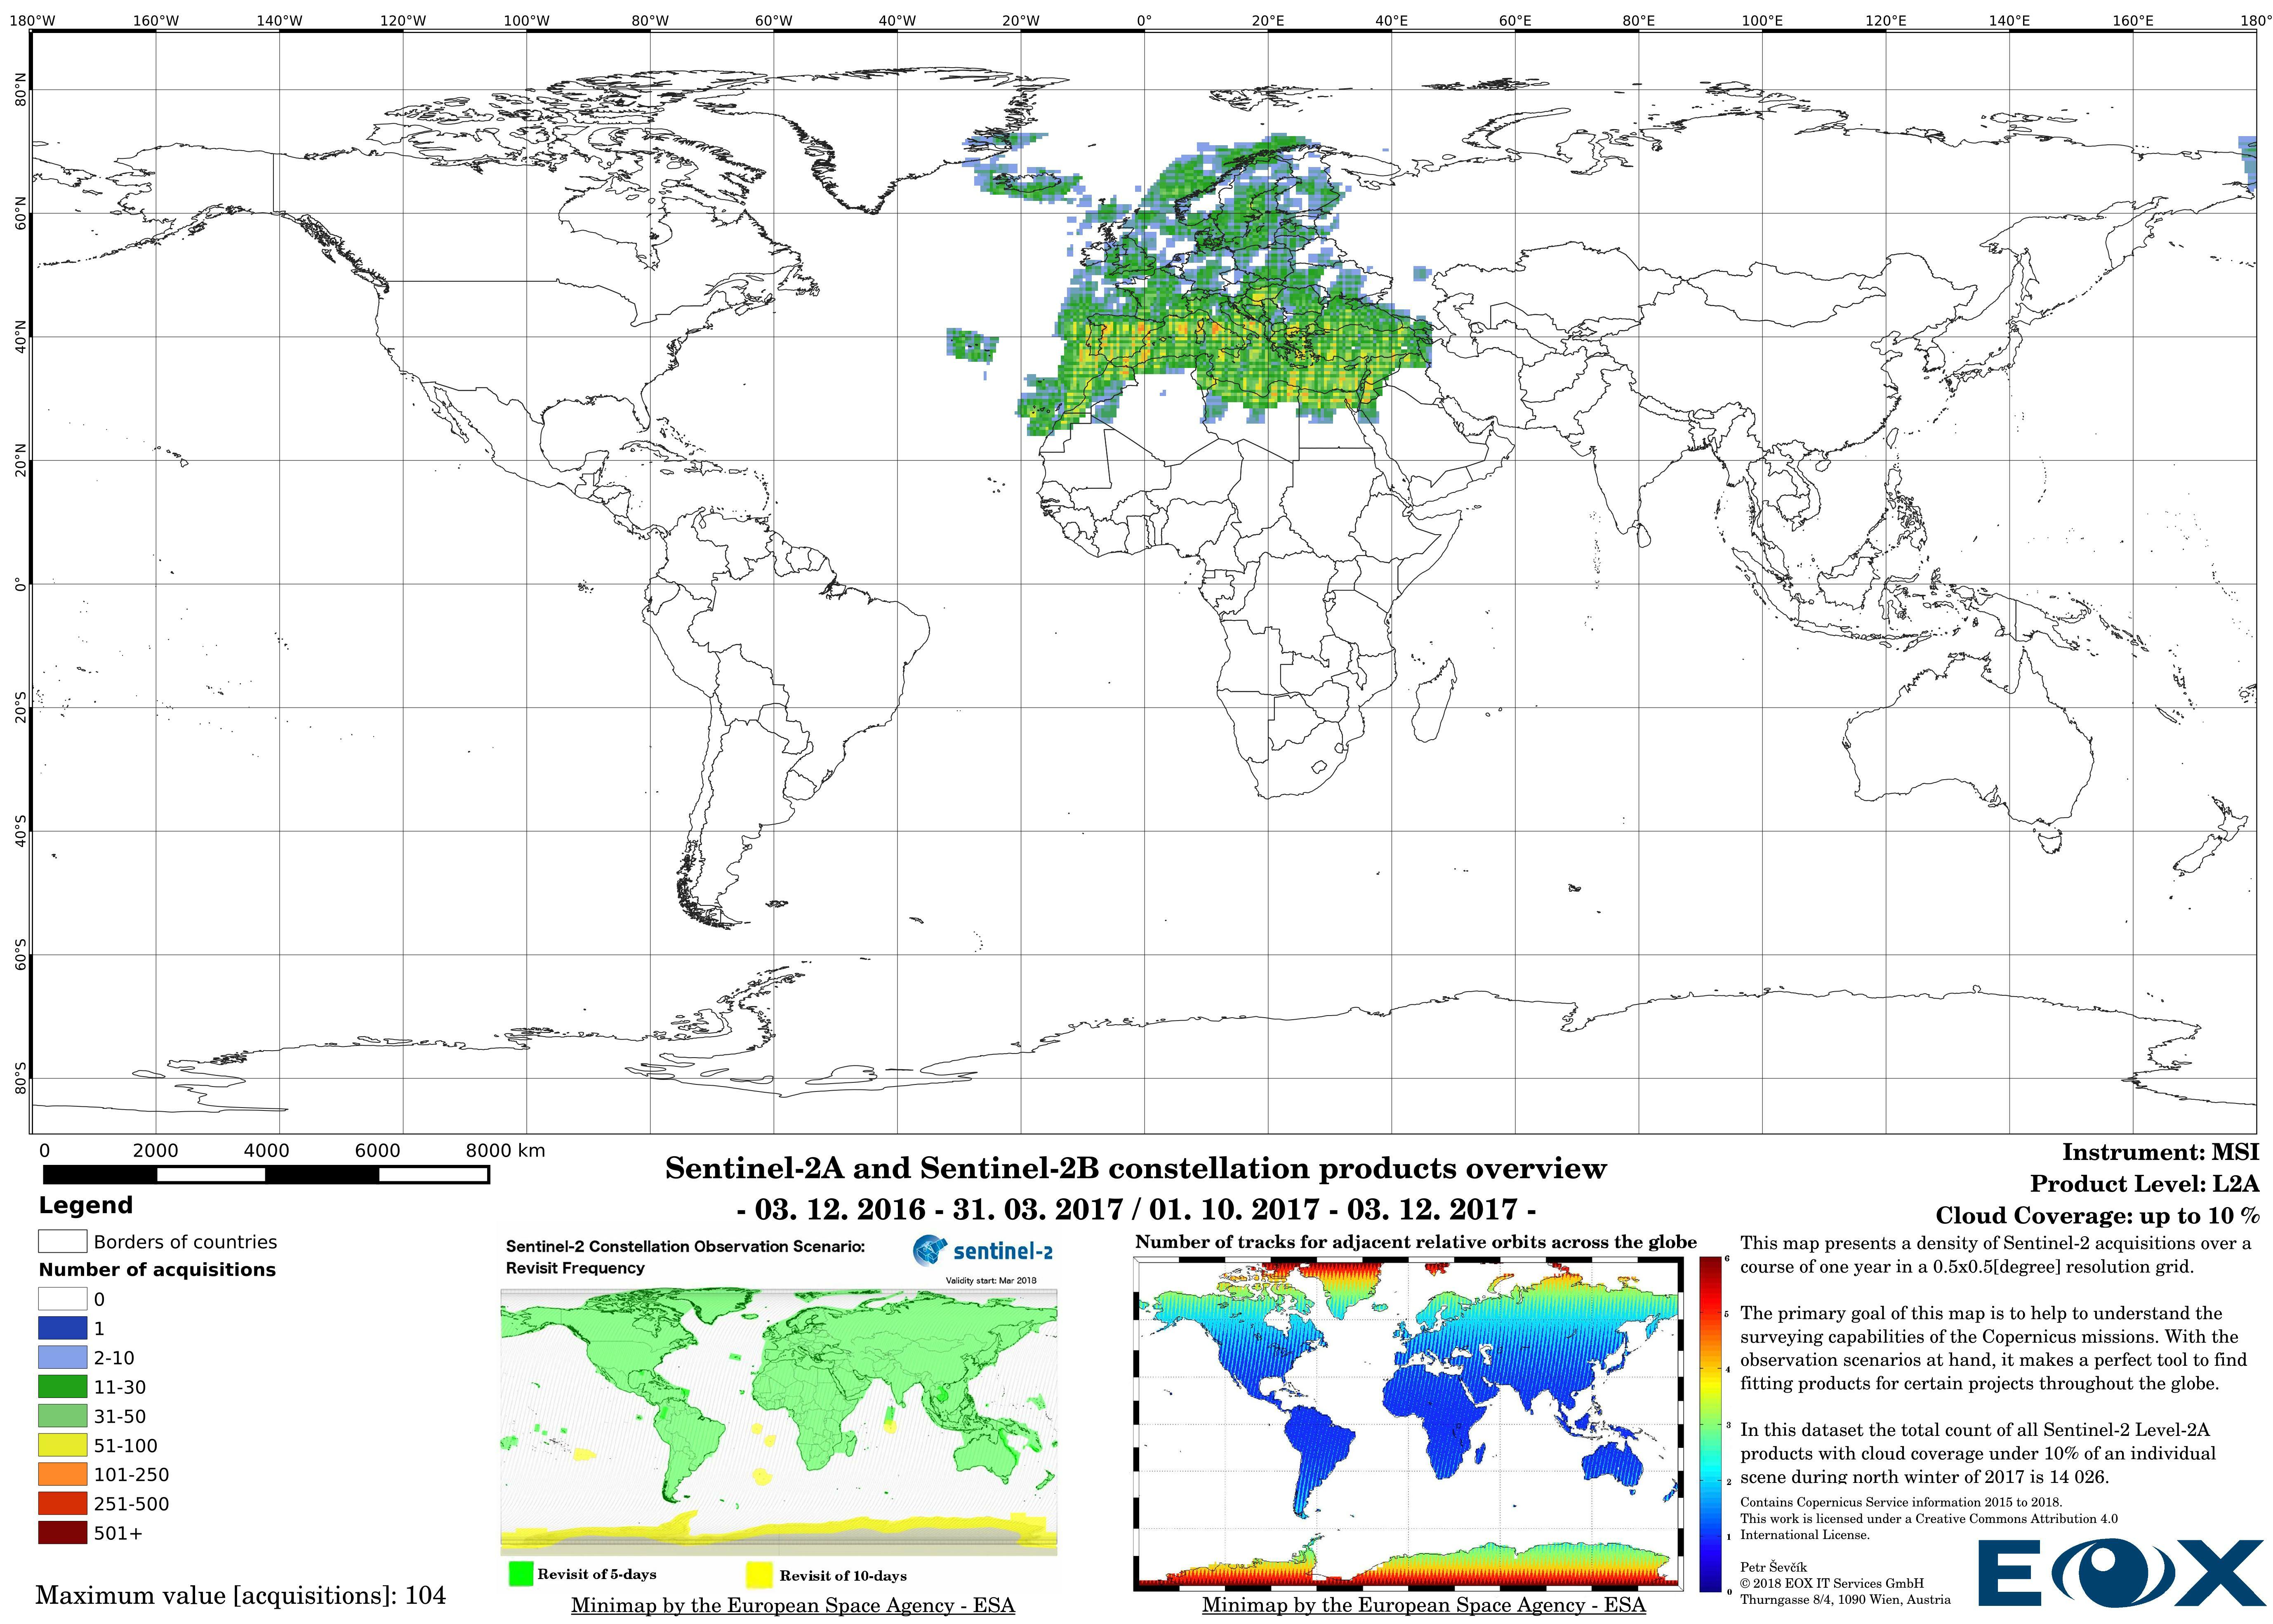
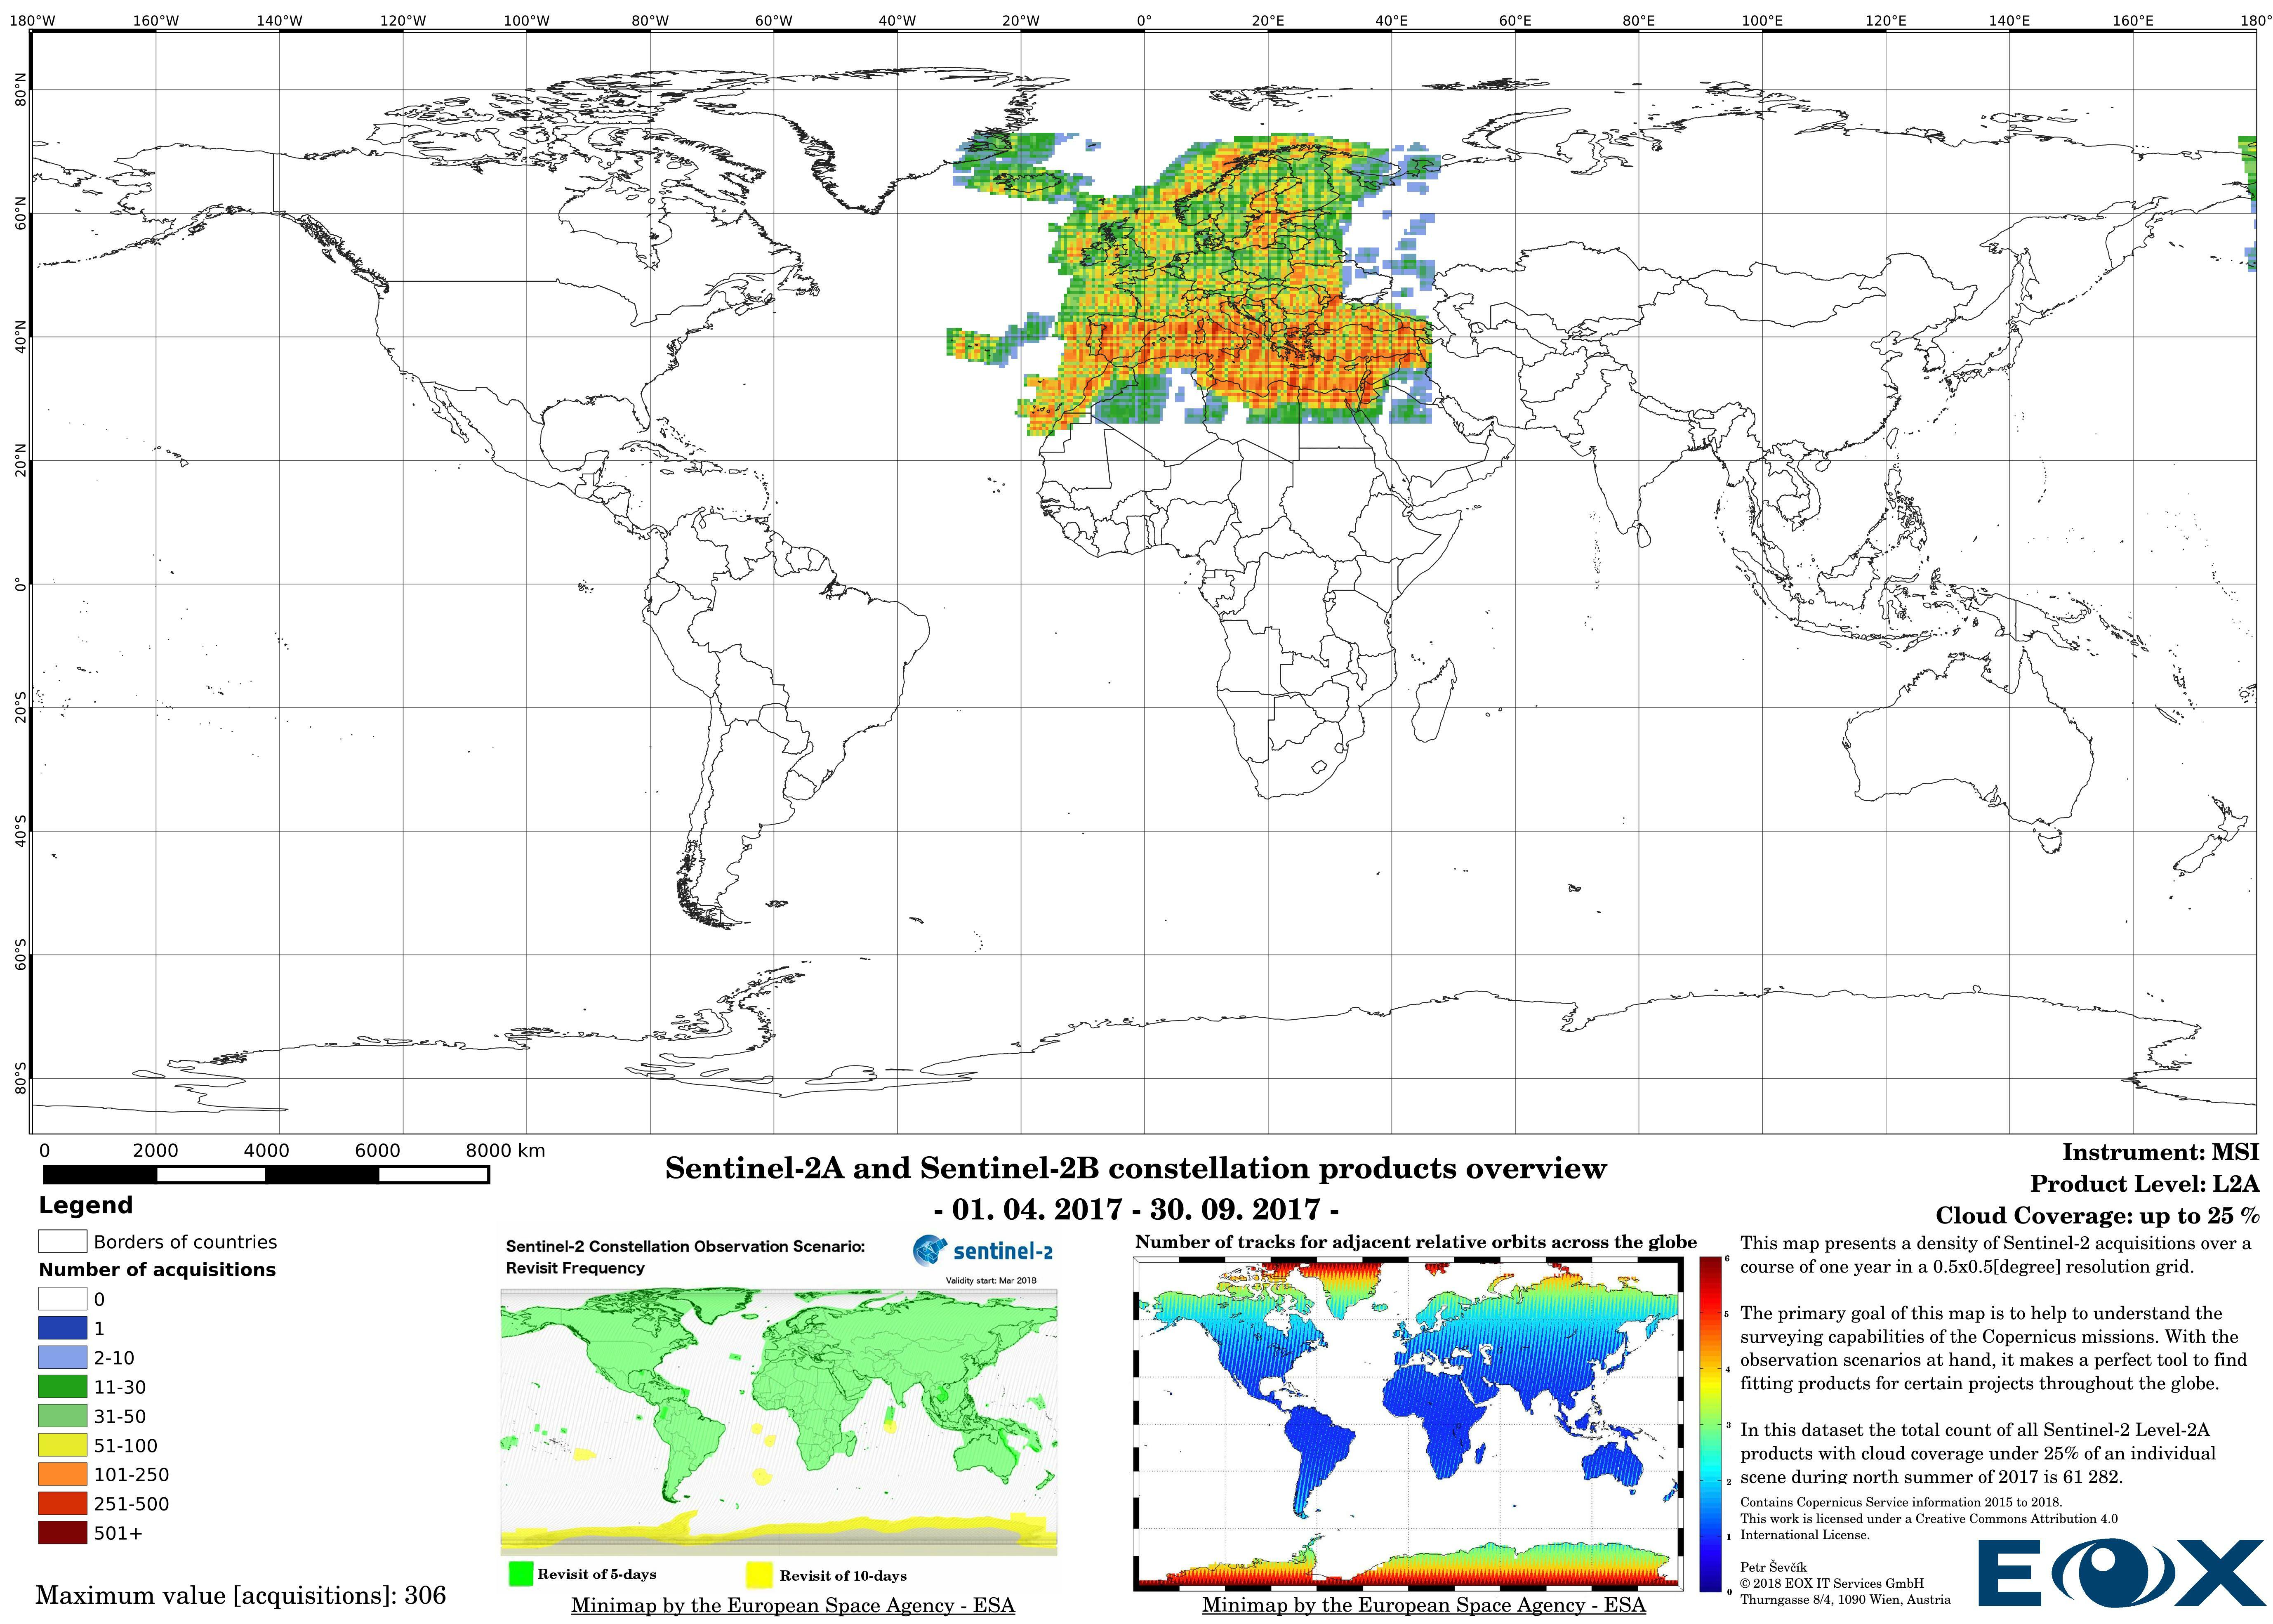
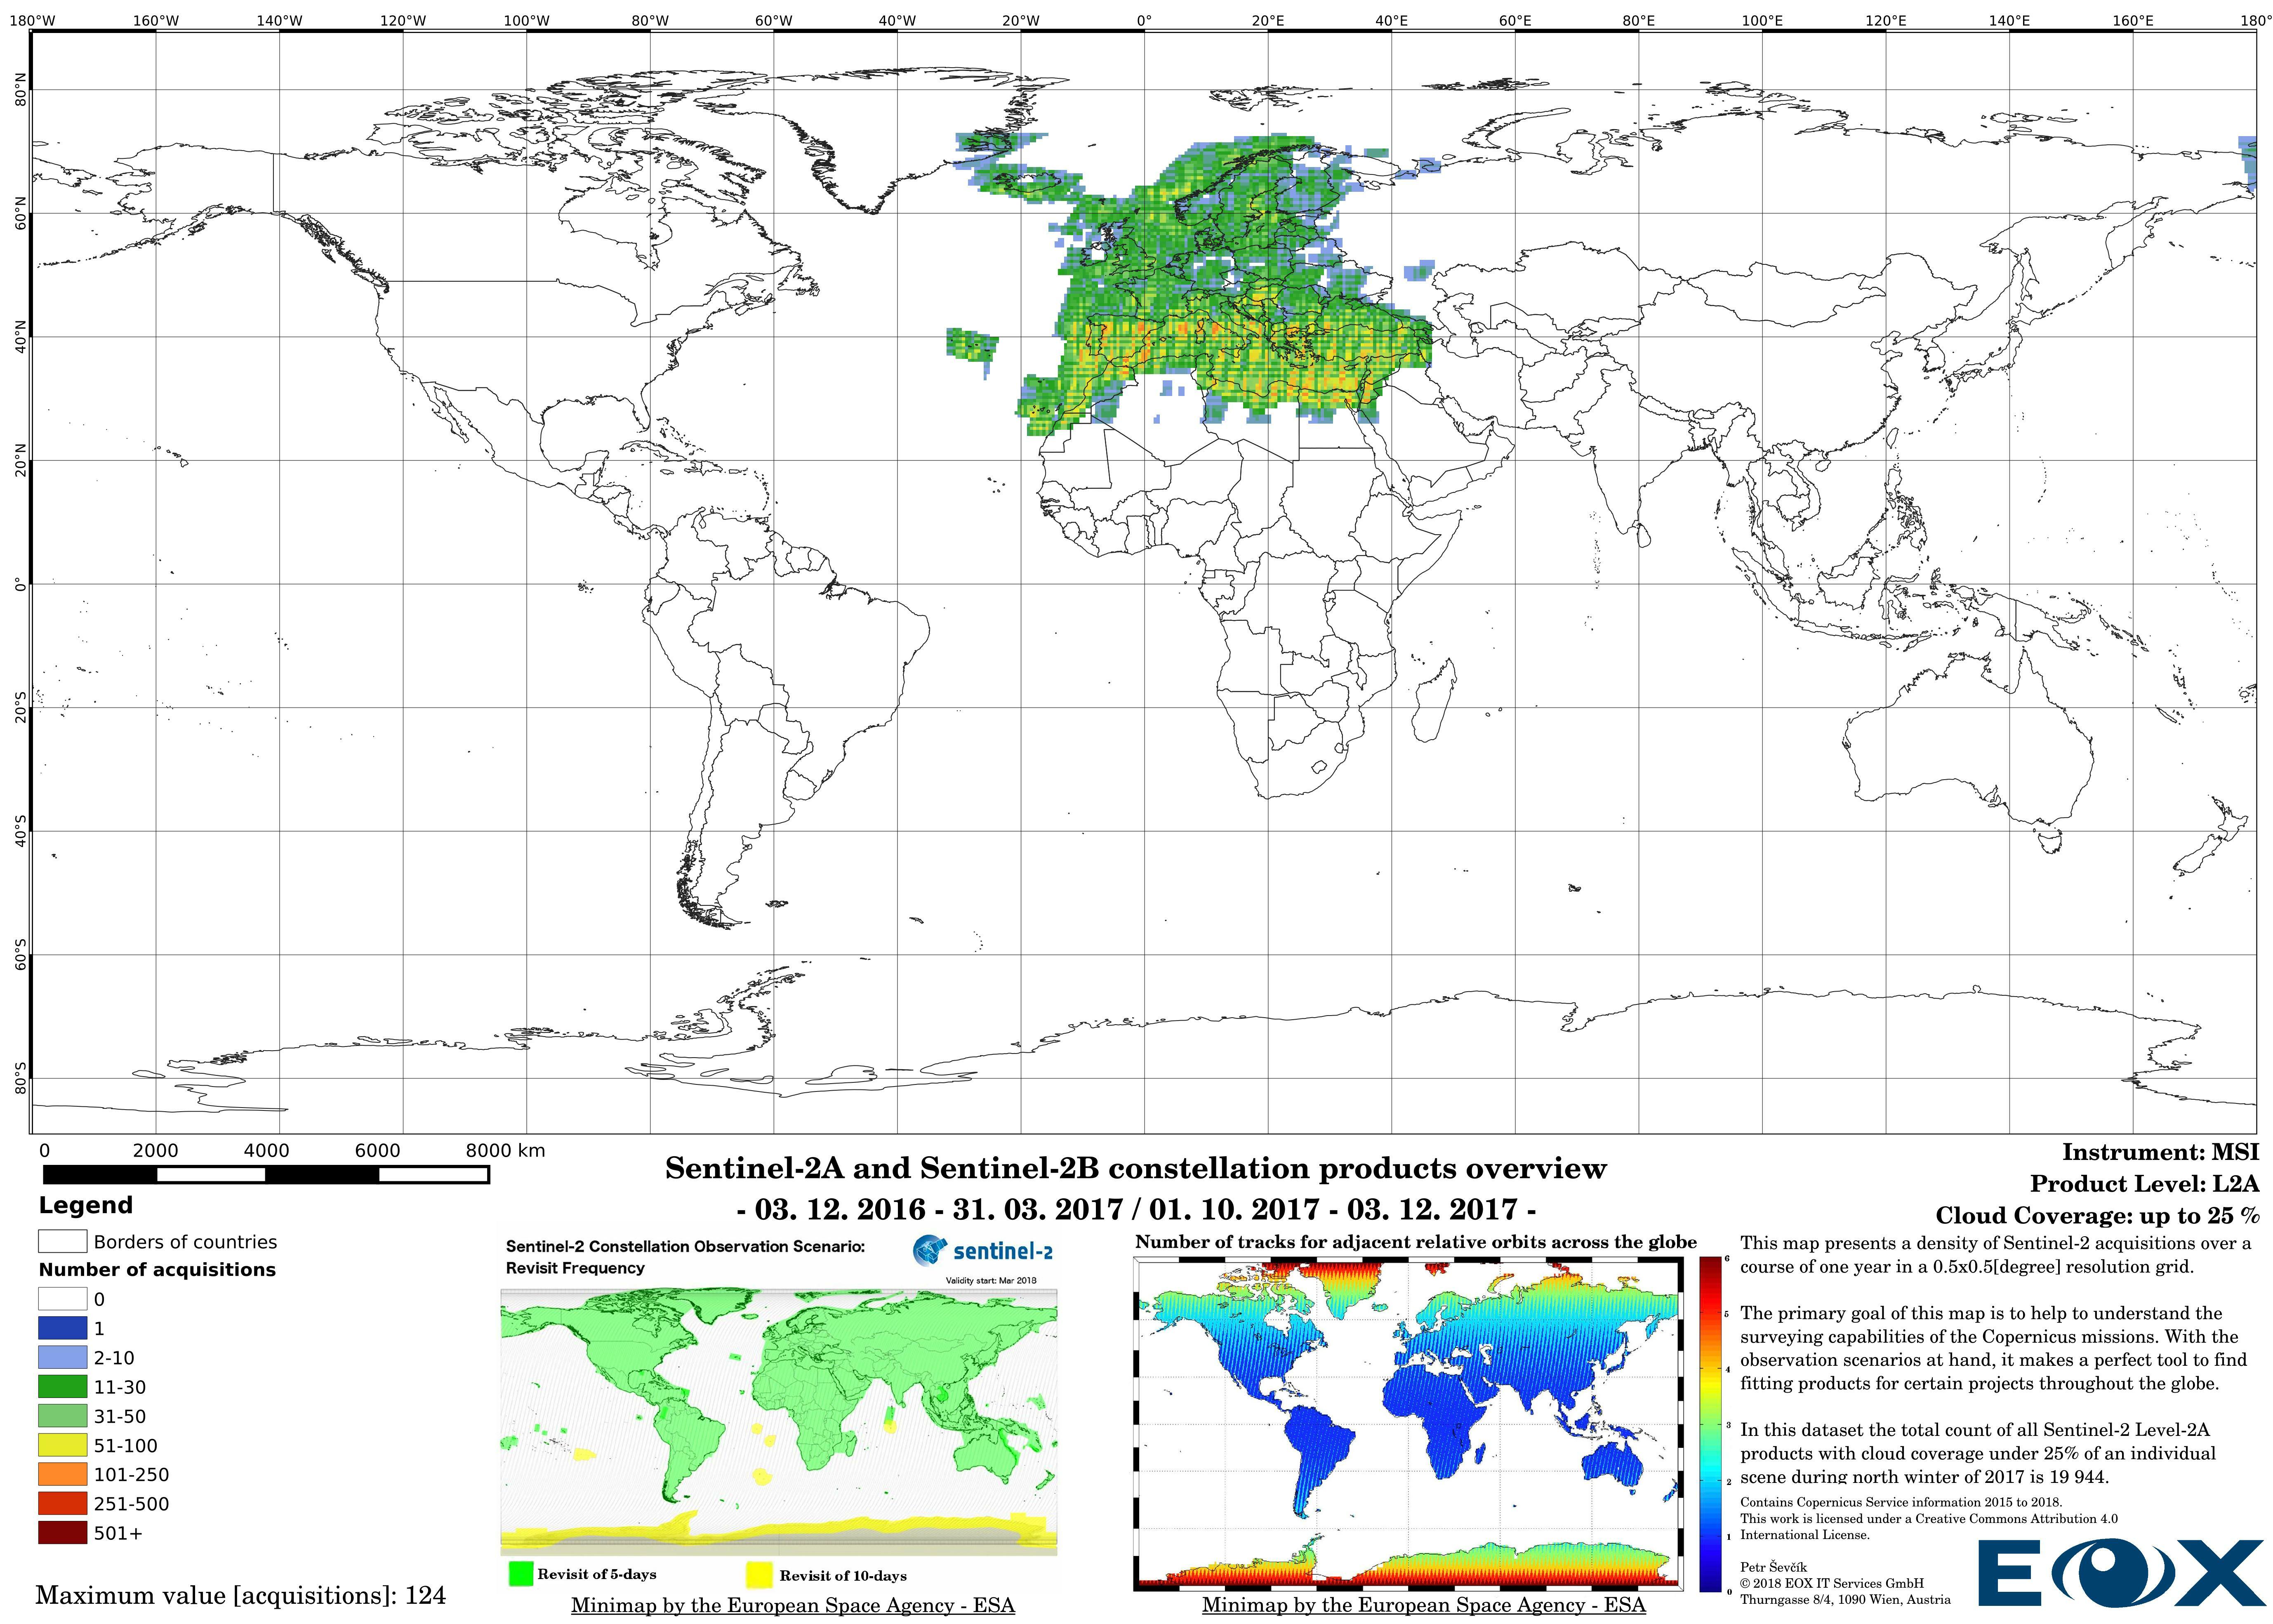
Up to the middle of March 2018 the Sentinel-2 Level-2A (opens new window) products are to be considered as preliminary data. Since then the Level-2A became an operational product, beginning with coverage of the Euro-Mediterranean region, with a gradual ramp-up to systematic worldwide coverage planned for the summer of 2018. The Level-2A operational processor generates the output, from algorithms of scene classification and atmospheric correction, Level-2A (Bottom of the Atmosphere - BOA reflectance) products from Level-1C (opens new window) products.
This concludes the description of the properties of the following maps. I hope it has provided some insight of how inhomogeneous the Sentinel-2 data is, based on both the physical properties and the datastructure itself.
# Here are some maps, that might help you when dealing with Sentinel-2 satellite data.
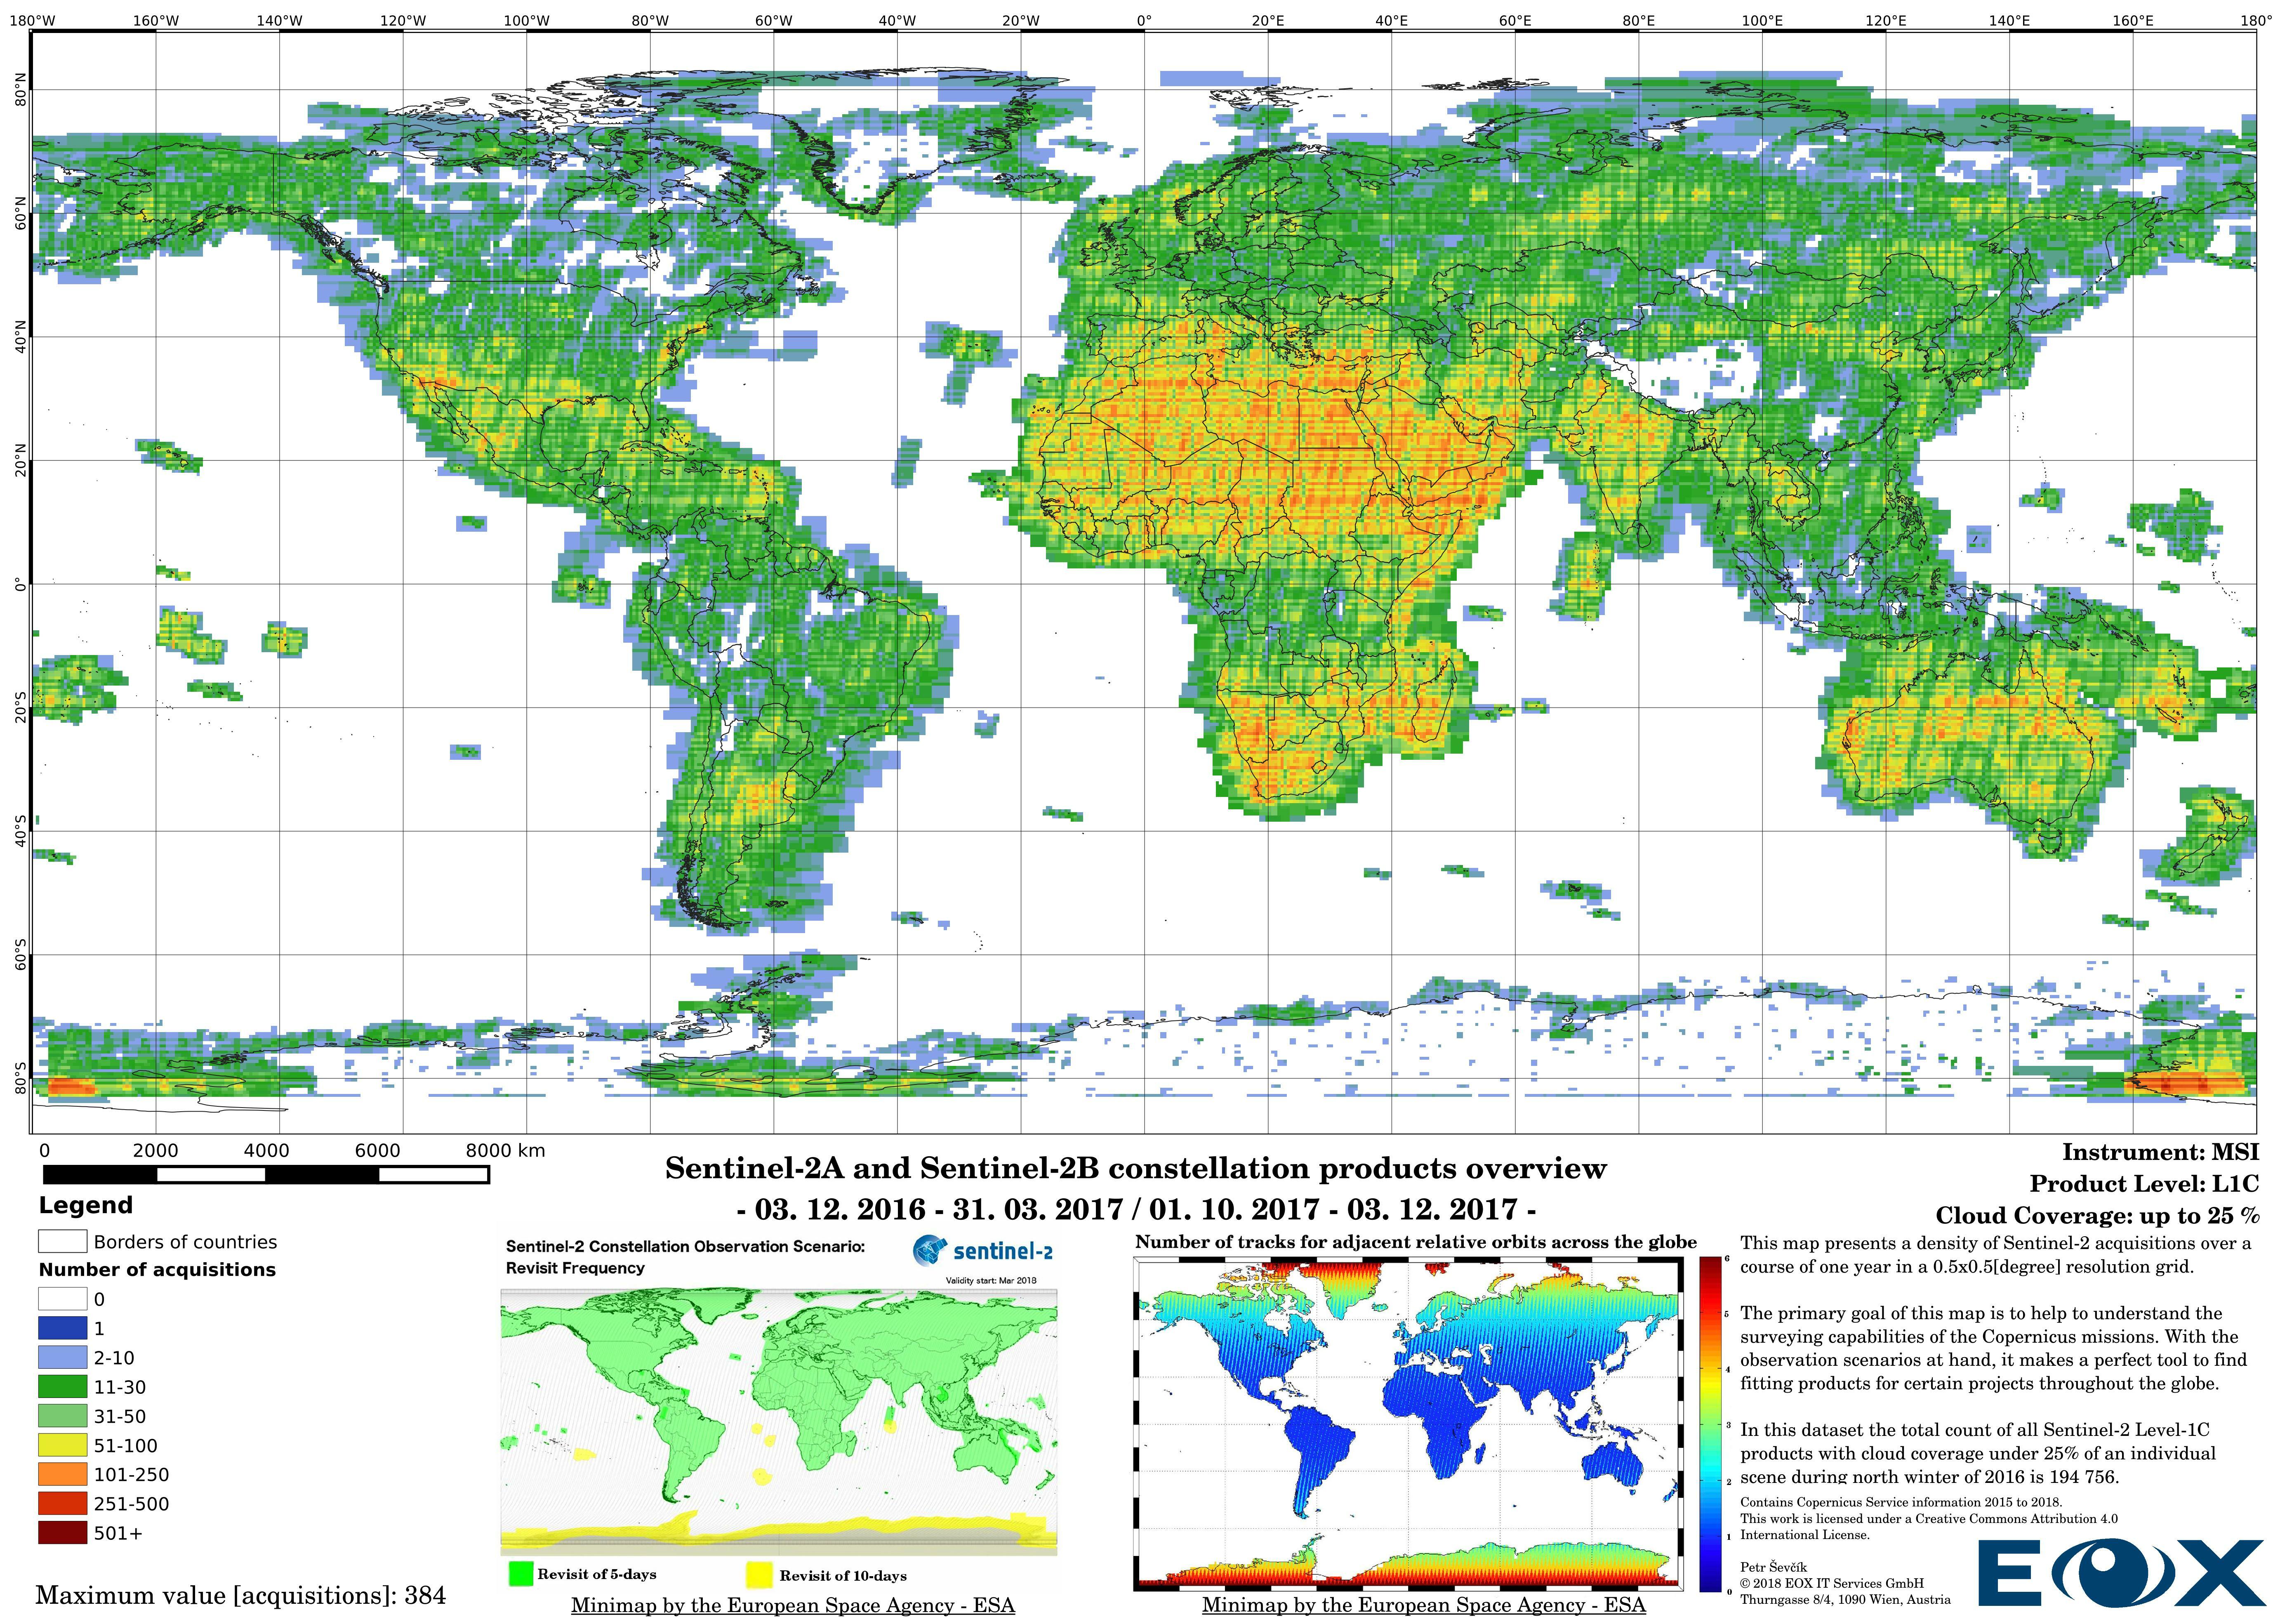
The maps are sorted out by processing level, cloud coverage for the summer and winter based on the seasons in the northern hemisphere, the coverage is global, therefore applicable for the southern hemisphere analogically.
# Sentinel-2 Level-1C density maps for the year 2017

# Sentinel-2 Level-2A density maps for the year 2017
# Sentinel-2 Level-1C density maps for the year 2016
Thank you for stopping by and if you have any questions, remarks or just want to discuss something write me an email, on the 2nd of May 2018 in Vienna, Austria Petr Ševčík, EOX IT Services GmbH Email: petr.sevcik@eox.at
Contains modified Copernicus Sentinel information 2015 to 2018.
Maps made in QGIS 2.18.