Understanding Sentinel-2 Satellite Data
This is the first entry in a series of posts about how to use data from Europe's Sentinel-2 satellites. Stay tuned as the remaining posts are going to be published over the next couple of months. As always, feedback is very much welcome. Please let us know which topics you want us to include.
Today we start with an introduction to Copernicus and the Sentinel missions before diving into Sentinel-2 product levels and data concepts from granules to user products. How to download Sentinel-2 data and how to decode the SAFE file format is going to be described in the next posts.
# Introduction to Copernicus
The Sentinel satellites (opens new window) are part of Europe's ambitious Copernicus programme (opens new window) (formerly known as Global Monitoring for Environment and Security (GMES)). The overall mission is composed of five constellations of satellites, each targeting a different application domain.
The Sentinel missions implement two interesting and important concepts. First, they fly in constellations of multiple satellites which provide more frequent data. Second, the data is released under an Open Data policy (opens new window) allowing free access to images and therefore fostering enhanced knowledge generation and application developments.
- Sentinel-1 (4 satellites) is a Synthetic Aperture Radar (C-band) mission designed to monitor sea ice zones, the Arctic environment, and the risk of land surface motion as well as generate forest, water, and soil mapping.
- Sentinel-2 (2 satellites) is an optical mission with a multi-spectral instrument mainly for agricultural applications such as crop monitoring and management, vegetation and forest monitoring (e.g. leaf area index, chlorophyll concentration, carbon mass estimations), monitoring land cover change for environmental monitoring, observation of coastal zones (marine environmental monitoring, coastal zone mapping), inland water monitoring, glacier monitoring, ice extent and snow cover mapping.
- Sentinel-3 (3 satellites) carries multiple instruments, mainly for sea-surface as well as sea and land ice topography, sea- and land-surface temperature, ocean- and land-surface colour, sea- and inland-water quality and pollution monitoring, land-use change monitoring, forest cover mapping, fire detection, marine and general weather forecasting, snow cover monitoring, measuring Earth's thermal radiation for atmospheric applications, and last but not least for overall environmental and climate monitoring and modelling.
- Sentinel-4 will be placed on geostationary Meteosat Third Generation satellites.
- Sentinel-5 plus Sentinel-5 Precursor are carried on the polar-orbiting MetOp Second Generation satellite. Both, Sentinel-4 and Sentinel-5, are dedicated to monitor the composition of the atmosphere for air quality, stratospheric ozone and solar radiation as well as climate monitoring.
Beside the above mentioned domains all Sentinels will fully support natural disaster management (risk analysis, loss assessment, disaster management, etc.) and humanitarian aid in crisis situations.
# Sentinel-2
After this short overview of the Sentinel missions we are going to focus on Sentinel-2 (S-2) and provide some more details about data from this recently started (opens new window) optical mission.
The Sentinel-2 constellation has currently one satellite in orbit, the second one is scheduled to start next year. The two satellites will fly at a height of 786 km and 180° degrees apart. The final constellation will provide a revisit time of five days at the Equator and proportionately more frequent in higher latitudes. It systematically covers all land and coastal areas between 84°N and 56°S. The data collection within this region includes islands greater than 100 km² in area, all islands in the European Union, all other islands within 20 km of a coastline, the whole Mediterranean Sea, all inland water bodies, and all closed seas.
Each satellite carries a single multi-spectral instrument (MSI), which provides 13 bands in the visible, near infra-red, and short wave infra-red part of the spectrum, at different ground resolution. The Table below shows a summary of the bands, their resolution and their application.
# Processing
Satellite data is provided in multiple levels typically ranging from 0 to 3, where 0 is unprocessed instrument and payload data at full resolution, and 3 means derived information, like a single percentage number.
Level-0 and Level-1A processing are performed by the ground segment and are in general not accessible to users. So we skip them here.
Level-1B and Level-1C processing is performed routinely by the S-2 ground segment and the results are available to users. We therefore provide a short overview on these products and go into more detail for Level-1C products later on.
Level-1B products represent Top-Of-Atmosphere calibrated radiances (TOA) in sensor geometry, and include radiometric corrections and the refinement of the physical geometrical viewing model (which is not applied at this level). Products are available as JPEG2000 lossless compressed images plus associated metadata, all capsuled within a SAFE file container (basically a zip-file, more details about SAFE in a later post). Level-1B is composed of granules (see also Figure below), one granule represents a sub-image (one for each band) of the satellite track, with a size of 25 km across-track and approx. 23 km along-track on ground. Each Level-1B granule has a data volume of approximately 27 MB. Level-1B products require expert knowledge of orthorectification techniques.
Level-1C products are radiometric and geometric corrected TOA products. The corrections include orthorectification and spatial registration on a global reference system (combined UTM projection and WGS84 ellipsoid) with sub-pixel accuracy. Level-1C images are delivered in tiles of 100x100 km (see also Figure below), each of which is approximately 500 MB. Products are available as JPEG2000 lossless compressed images plus associated metadata, all capsuled again within a SAFE file container. Currently, this type of data is the main target for almost all users.
Level-2 products are Bottom-Of-Atmosphere (BOA) corrected orthophotos. In addition they contain an Aerosol Optical Thickness (AOT) map, a Water Vapour (WV) map, and a Scene Classification Map (SCM) together with Quality Indicators (QI) for cloud and snow probabilities at 60 m resolution. They are resampled and generated with an equal spatial resolution for all bands, based on the requested resolution (10 m, 20 m, or 60 m)
Unfortunately, Level-2 products are currently not routinely generated by the ground segment but have to be generated by the users themselves (e.g. by using the Sentinel toolbox (opens new window), provided by ESA for free). However, the provisioning of Level-2 products, as a systematically generated core product of the ground segment, is currently assessed.
# Sentinel-2 Data Structure
# Datatakes & Datastrips
OK, lets start from the beginning i.e. a satellite flies over an area and scans the Earth surface. For the Sentinels this is named a "datatake" – the continuous acquisition of an image from one Sentinel-2 satellite in a given MSI imaging mode. The maximum length of an imaging datatake is 15,000 km (e.g. the continuous observation from northern Russia to southern Africa).
Since it is not possible for a single ground receiving station to cover such an area the term "datastrip" is introduced: within a given datatake, a portion of image downlinked during a pass to a given station is termed a "datastrip". If a particular orbit is acquired by more than one station, a datatake is composed of one or more datastrips. The maximum length of a datastrip downlinked to a ground station is approximately 5,000 km.
# Granules & Tiles
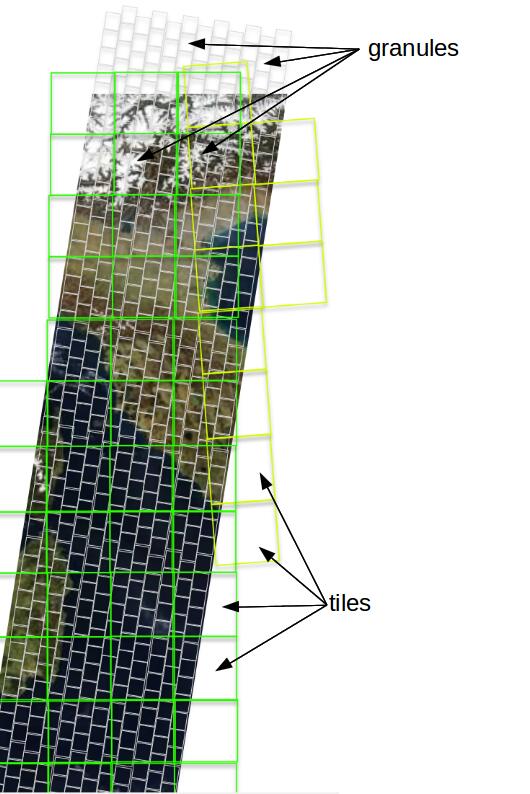
Now back to Level-1C products. In the whole concept of providing orthorectified, spatially co-registered (to a global reference system) data to users a confusion has been introduced. Specifically by allowing the usage of the same expression for different things. In order to avoid this confusion we will strictly use the term "granules" for the 25x23 km sub-images at Level-1B and the term "tiles" for 100x100 km sub-images a Level-1C and higher. The figure below (Courtesy of ESA) shall provide an impression of the meaning of these two terms. The underlying datastrip (the satellite image) forms the basis.
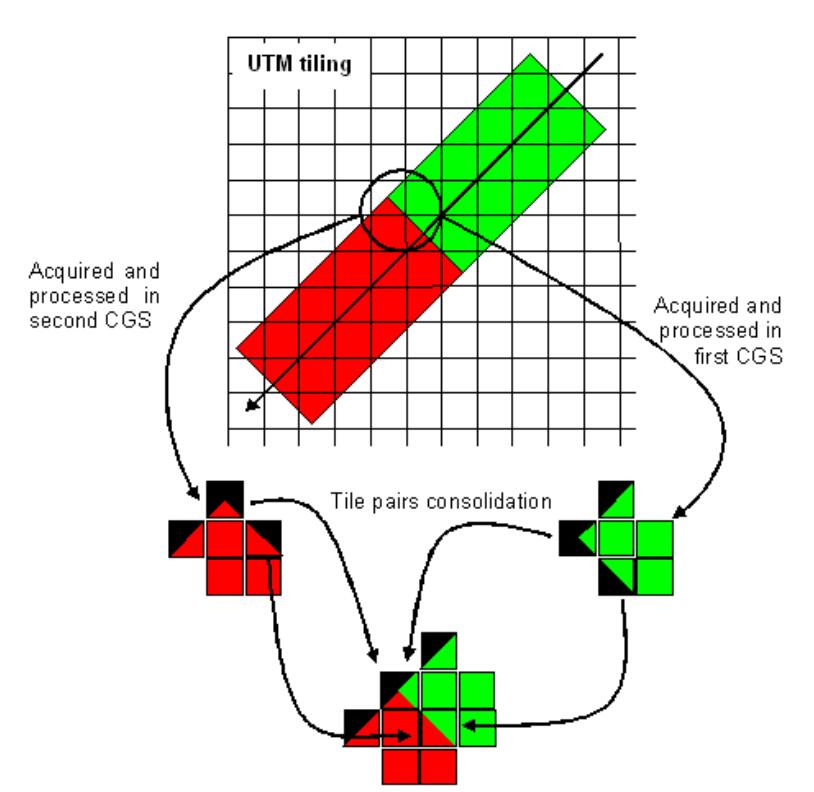
Since datatakes are usually composed of datastrips provided by multiple ground receiving stations (an exception would be if the data is transmitted via a geostationary satellite downlink) one question arises: “how are two adjacent ground stations handled?" The situation is illustrated in the figure below.
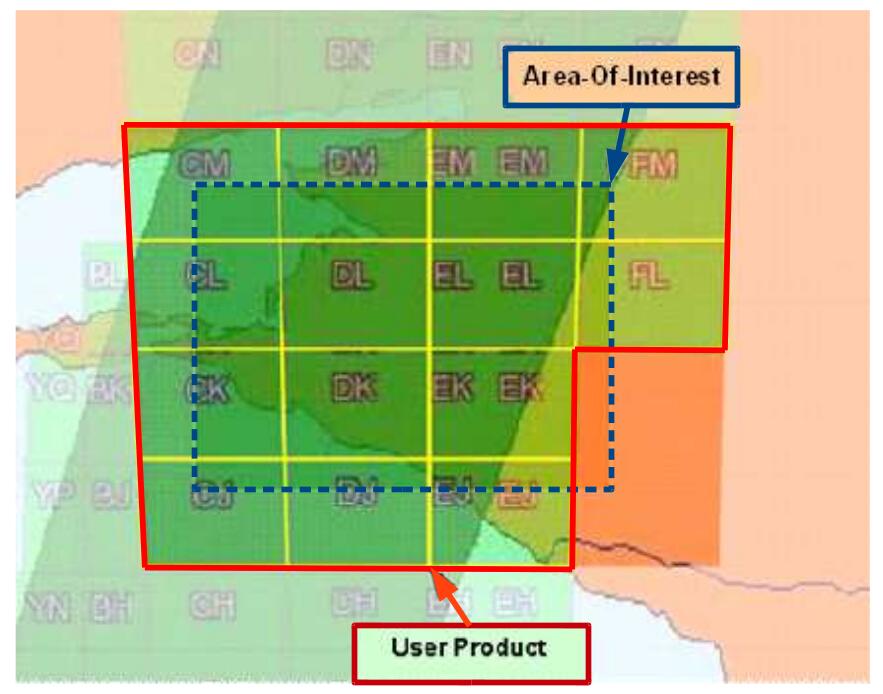
Another question, we have frequently discussed here at EOX, is the relationship between a datatake, the UTM reference tiling schema, the user defined Area-Of-Interest (AOI), and the actual product delivered to the user – the so called "User Product". The figure below provides a first impression of these relations, which will be explained in more detail together with the SAFE file format.
Thanks for reading this far but let's stop for now. Come back to learn how to download Sentinel-2 User Products, how to decode the used SAFE file format, and how to further process the data.