Visualizing Raster Data
As you may know, GeoTIFF images are a very common file format when dealing with geospatial raster data. Due to its versatility, it is used storing satellite data, as an intermediary file format in raster processing chains and as a delivery format for protocols such as WCS. As of WCS 2.0, there is even an application profile for GeoTIFF format encoding.
The popularity of GeoTIFF is due to good reasons:
- GeoTIFF is based on the mature and very versatile TIFF standard and fully backwards compatible.
- It is able to store scientific raster data: this includes samples such as Float or larger integer types.
- It allows to use internal compression, such as LZW, Deflate or JPEG.
- It allows the internal tiling of large raster files, greatly improving the performance when reading only subsets of the raster.
- The different "bands" (such as red, green, blue or more specific ones) can either be interleaved or separate, depending on the use case.
- TIFF (and thus GeoTIFF) is extensible: additional tags and data can be added for various purposes (maybe that's why some refer to it as Thousands Incompatible File Formats).
There is just one drawback: GeoTIFFs often contain data that cannot be visualized directly and thus common browsers do not support TIFF rendering.
# geotiff.js and plotty.js to the rescue!
In order to allow neat visualizations in the browser with standard HTML 5, Daniel and I created two different tools: geotiff.js (opens new window) and plotty.js (opens new window).
As the name implies, geotiff.js is a GeoTIFF decoding library implemented in JavaScript using HTML 5 facilities. The library supports all the major features required for scientific rasters, and a broad range of TIFF features are covered. It allows to read native JavaScript arrays of the full image or a subset thereof that can be further processed.
plotty.js, on the other hand, is a library to quickly colorize raster data with a set of prepared color scales. It allows to adjust the color scale, value range and actual values on the fly and render it directly on the web page. For the best performance plotty.js uses WebGL whenever possible but falls back to a software rendering for all other cases.
Though they are separate libraries, they complement each other very well: geotiff.js loads the raster arrays from the GeoTIFF files that are then put into the plotty.js to produce a presentable rendering that can either be put on the web page itself or used for another purpose (such as using it as a texture for a 3D rendering).
# How does it look?
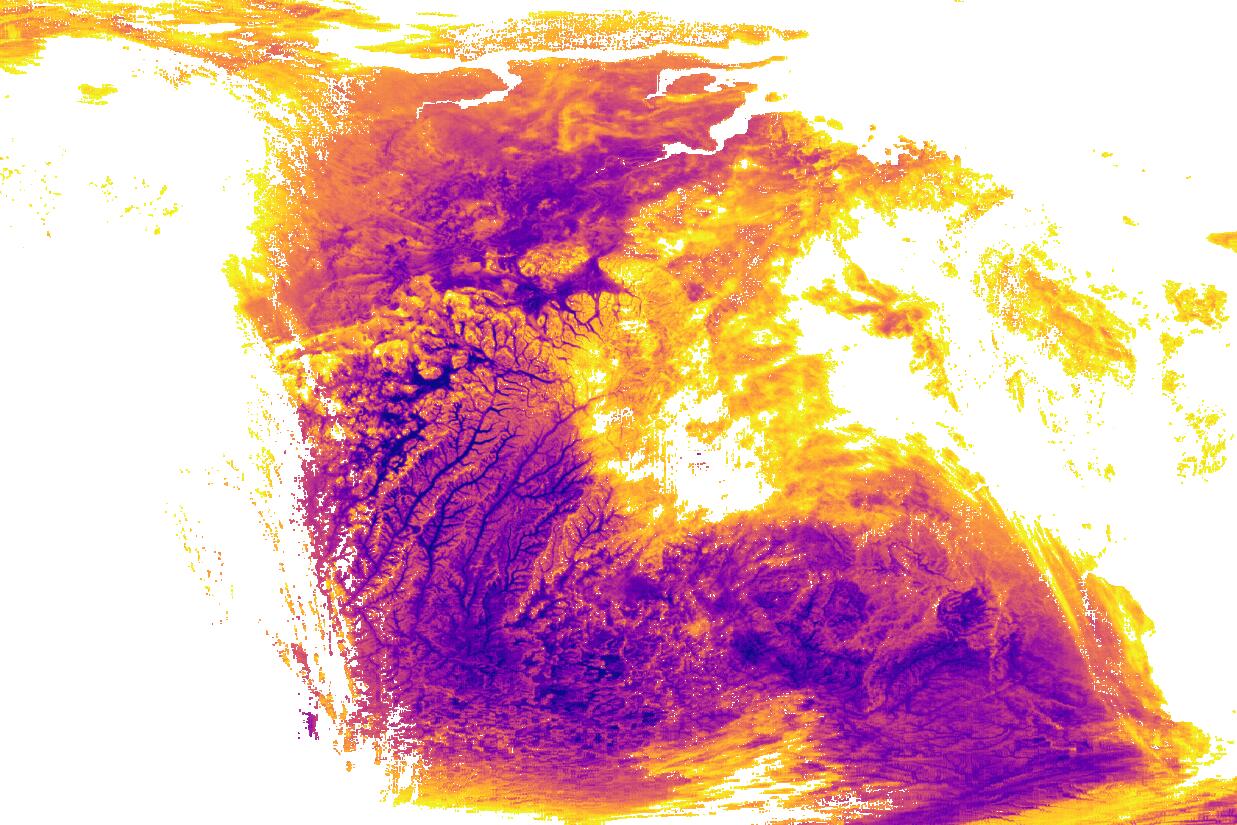
The following example shows the capabilities of the two combined libraries quite well. The TIFF image is downloaded and decoded using geotiff.js and then rendered using plotty.js. The color scale, the lower and upper bounds and the clamp settings can be adjusted dynamically and the result is displayed directly:
# Going further
Since plotty renders into an HTML canvas, the rendered result is usable in a variety of ways. Such as putting it onto an OpenLayers map:
In the above example, a WCS Server is employed that serves a Digital Elevation Model (DEM) over the austrian alps. The server creates a subset of the actual raster stored on the server and responds with the raster encoded as GeoTIFF and transformed to a compatible map projection. The data is rendered only between the heights 600m and 1300m with no clamping enabled, resulting in this "rugged" look, where the valleys and summits are cut out.
The following video shows an advanced use case, implemented for the TAMP Project, where a GeoTIFF containing a 3D array is visualized on a globe.
The next video shows a similar approach (also from the TAMP project), but this time multiple GeoTIFFs are loaded and then animated. Again, the user can control various parameter of the rendering.
# In the future?
Although plotty.js and geotiff.js are already quite advanced and used in production there is still some functionality missing:
- Compression: Currently only raw encoding and PackBits compression are supported by geotiff.js. Hopefully other compression types will follow soon (Deflate, LZW, JPEG, etc...)
- RGB Data: The current focus of geotiff.js is support scientific data. But there are also several possibilities to encode RGB data in GeoTIFF files. For these cases, an additional renderer would not be necessary.
- Geospatial Metadata: Though geotiff.js parses the geospatial metadata (such as the projection and extent of the image and so on), the full potential is not yet reached. For example the data could be warped on the fly and put onto a map using a different projection.
- Raster combination: Currently, plotty.js renders a single array and performs a linear scaling to produce the output image. But other methods of scaling or interpolation come to mind: cubic interpolation could produce smoother outputs, logarithmic scaling might be more useful for some data, dynamic combinations of rasters might provide tools helpful for some tasks.
We're happily accepting pull requests (opens new window) if you want to grab an item.
# Conclusion
JavaScript and HTML 5 have come a long way, and are accessing domains that were previously only possible for native desktop applications. The concept of geotiff.js is surely adaptable for other file formats as well, that were previously only exploitable by full blown desktop applications (NetCDF and HDF come to mind...).
# Update
I had the opportunity to hold a talk about geotiff.js and plotty on the FOSS4G conference in Bonn. It was a great experience to talk in front of such a large and interested audience. I am thankful for valuable feedback and comments I got. You can see the video recording of my talk: